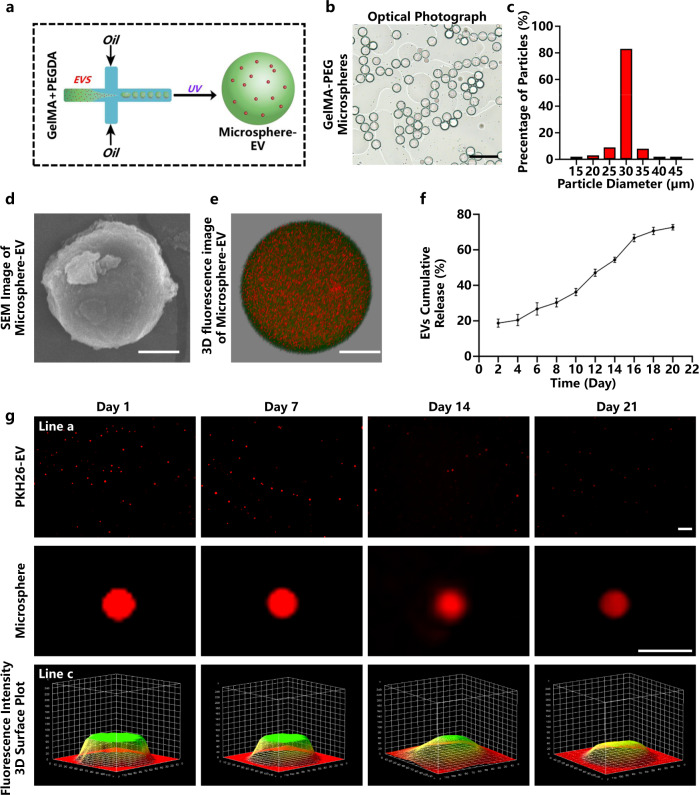
Fig. 4. Preparation and characterization of gelatin methacryloyl-polyethylene glycol (GelMA-PEG) microspheres.
a Schematic diagram of the preparation principle of GelMA-PEG microsphere-encapsulated EVs. This Figure was created with BioRender.com. b Optical photograph of GelMA-PEG microspheres. Scale bar = 100 μm. c Particle size analysis of the microspheres. d Scanning electron microscopy (SEM) image of GelMA-PEG microspheres. Scale bar = 10 μm. e Three-dimensional fluorescence image of EV-encapsulated microspheres taken by confocal microscopy. Microspheres (fluorescein isothiocyanate (FITC) labeled, green fluorescence), EVs (1,1’-dioctadecyl-3,3,3’,3’-tetramethylindocarbocyanine perchlorate-labeled (PKH26-labeled), red fluorescence), scale bar = 10 μm. f The release profile of extracellular vesicles from microspheres was detected by a spectrofluorometer (n = 3, independent experiment replicates per group). g Fluorescence microscopy images of PKH26-EV-encapsulated microspheres after immersion in phosphate-buffered saline (PBS) for 1, 7, 14, and 21 days (line a, scale bar = 200 μm); magnified single microsphere images (line b, scale bar = 50 μm) and fluorescence intensity 3D surface plot (line c). Data are presented as the mean ± standard. Two-tailed Student’s t-test was used to compare the differences between two groups. One-way ANOVA and post hoc Bonferroni tests were used to compare differences among more than two groups. Source data are provided as a Source Data file. Each experiment was repeated 3 times or more independently with similar results.

