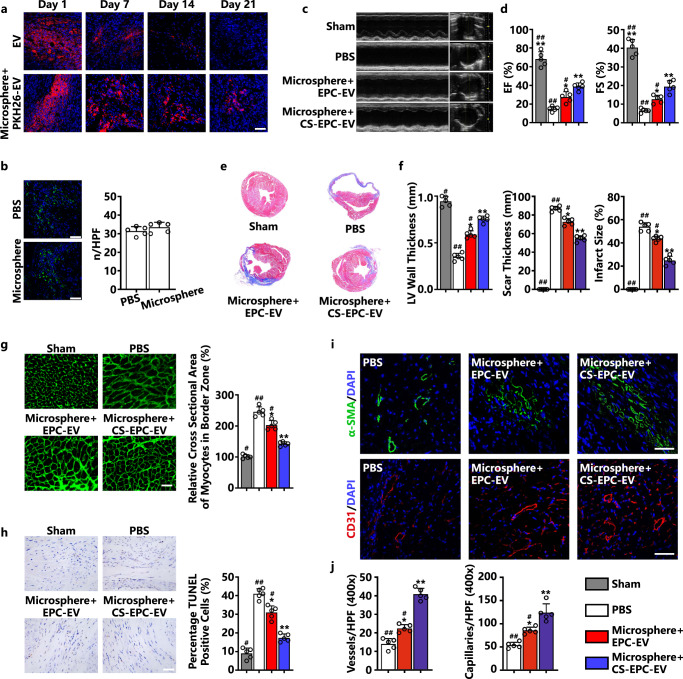
Fig. 5. Microsphere+CS-EPC-EVs can improve cardiac function after myocardial infarction, reduce cardiac remodeling, inhibit cardiomyocyte apoptosis, and increase angiogenesis (n = 5, biological replicates per group).
a Confocal fluorescence microscopy images of PKH26-EV-encapsulated microspheres in the area of mouse myocardial infarction at 1, 7, 14, and 21 days, Scale bar = 50 μm. PKH26-EV (red fluorescence), DAPI (blue fluorescence). b CD68 immunofluorescence staining of macrophages in cardiac tissue on Day 7 after myocardial infarction, Scale bar = 50 μm. CD68 (green fluorescence) and DAPI (blue fluorescence). Quantitative analysis of the number of CD68-positive cells. c M-mode ultrasound images on Day 21 after myocardial infarction. d Quantification of the ejection fraction (EF) and fractional shortening (FS) of the animals on Day 21 after myocardial infarction. e Masson staining of hearts on Day 21 after myocardial infarction. f Statistical analysis of left ventricular wall thickness, scar thickness and infarct size. The number of hearts = 5. g Wheat germ agglutinin immunofluorescence staining of myocardial cells in the marginal zone of myocardial infarction on Day 21 after myocardial infarction, scale bar = 50 μm. Cross-sectional area measurements of cardiomyocytes in the marginal zone of myocardial infarction. h TUNEL staining in the infarct margin area on Day 21 after myocardial infarction, Scale bar = 100 μm. Total nuclei (DAPI staining, blue) and TUNEL-positive nuclei (tan). Quantitative analysis of TUNEL-positive cardiomyocytes. i Immunofluorescence staining pictures of small arteries in the peripheral area of myocardial infarction on Day 21 after myocardial infarction, scale bar = 50 μm. Alpha-smooth muscle actin (α-SMA, green fluorescence) and DAPI (blue fluorescence). Immunofluorescence staining of capillaries in the peripheral area of myocardial infarction on Day 21 after infarction. CD31 (red fluorescence) and DAPI (blue fluorescence). j Quantitative analysis of immunofluorescence staining of arterioles and capillaries. *p < 0.05 and **p < 0.01 vs. the PBS group; #p < 0.05, ##p < 0.01 vs. microsphere+CS-EPC-EVs. Data are presented as the mean ± standard. Two-tailed Student’s t-test was used to compare the differences between two groups. One-way ANOVA and post hoc Bonferroni tests were used to compare differences among more than two groups. Source data are provided as a Source Data file. Each experiment was repeated 3 times or more independently with similar results.

