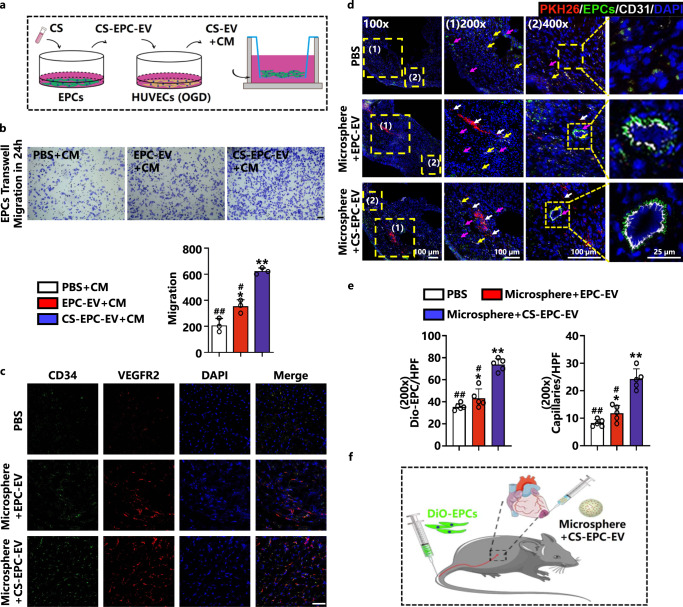
Fig. 6. CS-EPC-EVs promote EPCs migration in vitro and in vivo.
a Schematic of coincubation. This Figure was created with BioRender.com. b Transwell experiments and quantitative analysis of EPCs with different conditioned media under normoxia. *p < 0.05, **p < 0.01 vs. OGD; #p < 0.05, ##p < 0.01 vs. CS-EV+CM (n = 3, biological replicates per group), scale bar = 50 μm. c Cluster of Differentiation 34/Vascular Endothelial Growth Factor Receptor 2 (CD34+/VEGFR2+) immunofluorescence staining of EPCs in the peripheral area of myocardial infarction on Day 7 after infarction. CD34+ (red), VEGFR2+ (green), DAPI (blue), CD34+/VEGFR2+ (orange), scale bar = 50 μm, specimens (n = 5, biological replicates per group). d Fluorescence images of 3,3’-Dioctadecyloxacarbocyanine Perchlorate-EPCs (DiO-EPCs) and CD31-positive capillaries in the peripheral area of myocardial infarction on Day 7 after infarction. (1) and (2) are images of the corresponding area zoomed in on the yellow dot box. PKH26-EV (red fluorescence, white arrow), DiO-EPC (green fluorescence, purple arrow), CD31 (white fluorescence, yellow arrow), and DAPI (blue fluorescence) (n = 5, biological replicates per group). e Quantitative analysis of DiO-EPCs and the number of capillaries in the peripheral area of myocardial infarction (200 x magnification). *p < 0.05, **p < 0.01 vs. the PBS group; #p < 0.05, ##p < 0.01 vs. microsphere+CS-EPC-EVs (n = 5, biological replicates per group). f Schematic diagram of the DiO-EPCs injection and microsphere+CS-EPC-EV treatment of infarcted nude mice. This Figure was created with BioRender.com. Data are presented as the mean ± standard. Two-tailed Student’s t-test was used to compare the differences between two groups. One-way ANOVA and post hoc Bonferroni tests were used to compare differences among more than two groups. Source data are provided as a Source Data file. Each experiment was repeated 3 times or more independently with similar results.

