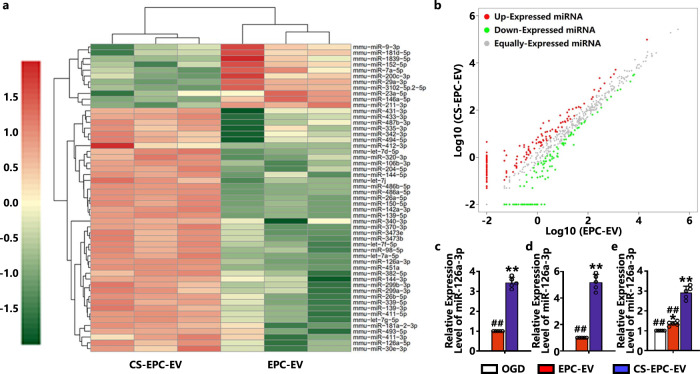
Fig. 7. Silicate ions from CS bioceramics promote the expression of angiogenesis-related factors and miRNAs in EPC-derived EVs.
a Heatmap of miRNA differential expression analysis between samples. Red represents upregulated genes, green represents downregulated genes, and color depth represents log10(COUNT+1) values. b Scatter plot of miRNA differential expression analysis between samples. Red dots indicate significantly upregulated miRNAs, and green dots indicate significantly downregulated miRNAs. c The expression of miR-126a-3p in the EVs was measured by qRT‒PCR. **p < 0.01 vs. EPC-EVs, ##p < 0.01 vs. CS-EPC-EVs (n = 5, biological replicates per group). d qRT‒PCR detection of miR-126a-3p expression in EPCs after silicate ion treatments. *p < 0.05 and **p < 0.01 vs. EPC-EVs (n = 5, biological replicates per group). e The expression of miR-126a-3p in HUVECs treated with different EVs under glucose and oxygen deprivation (n = 5, biological replicates per group) **p < 0.01 vs. OGD, ##p < 0.01 vs. CS-EPC-EVs. Data are presented as the mean ± standard. Two-tailed Student’s t-test was used to compare the differences between two groups. One-way ANOVA and post hoc Bonferroni tests were used to compare differences among more than two groups. Source data are provided as a Source Data file. Each experiment was repeated 3 times or more independently with similar results.

