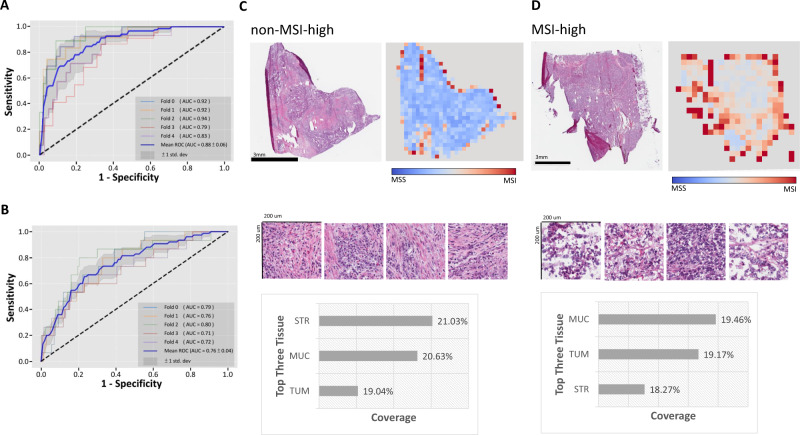
Fig. 6. MOMA predicts MSI status in colorectal cancer patients.
A Our MSI prediction model achieves an area under the receiver operating characteristic curve (AUC) of 0.88 in the TCGA held-out test set. B Our MSI prediction model is further validated in the Nurses’ Health Study and Health Professionals Follow-up Study cohorts (AUC = 0.76). C Attention visualization of a pathology image with non-MSI-high cancer. Informative regions of cancer-associated stroma, cancer cells, and mucus in this prediction task are automatically highlighted by our trained machine learning model. D Attention visualization of a pathology image with MSI-high cancer. Regions with adenocarcinoma cells and their adjacent stroma receive high attention. STR cancer-associated stroma, MUC mucus, TUM colorectal adenocarcinoma epithelium.

