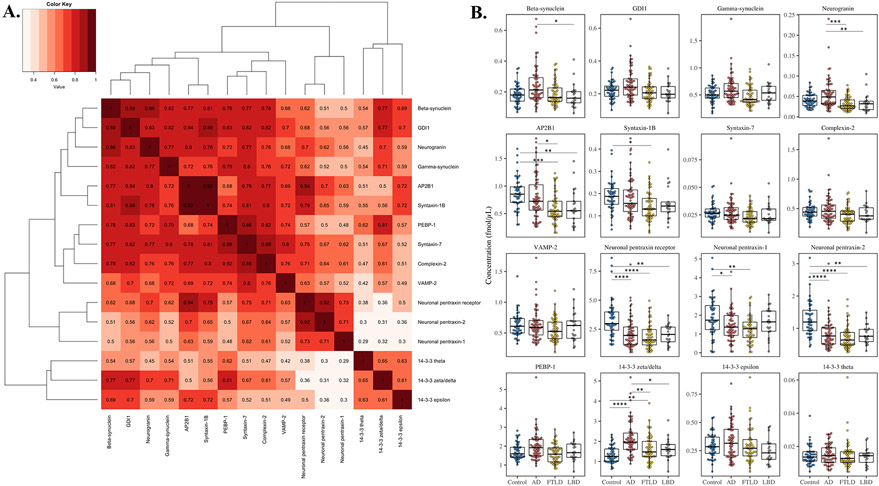
Figure 1.
(A) Hierarchical cluster analysis by using Spearman rank correlation coefficient as distance. From the cluster analysis it emerged that some of the measured proteins correlated strongly with each other. (B) MRM analysis of the synaptic panel proteins (one representative peptide for each protein) in the clinical sample consisting of healthy controls (HC, n=48), and pathology confirmed cases of Alzheimer’s disease (AD, n=63), Lewy body spectrum of disorders (LBD, n=21), and frontotemporal lobar degeneration (FTLD, n=53). Statistical comparison was performed with rank-based analyses of covariance, including age and sex as covariates, with p-value adjustment for multiple group comparisons. P-values: * p ≤ 0.05, ** p ≤ 0.01, *** p ≤ 0.001 and **** p ≤ 0.0001.

