Figure 1.
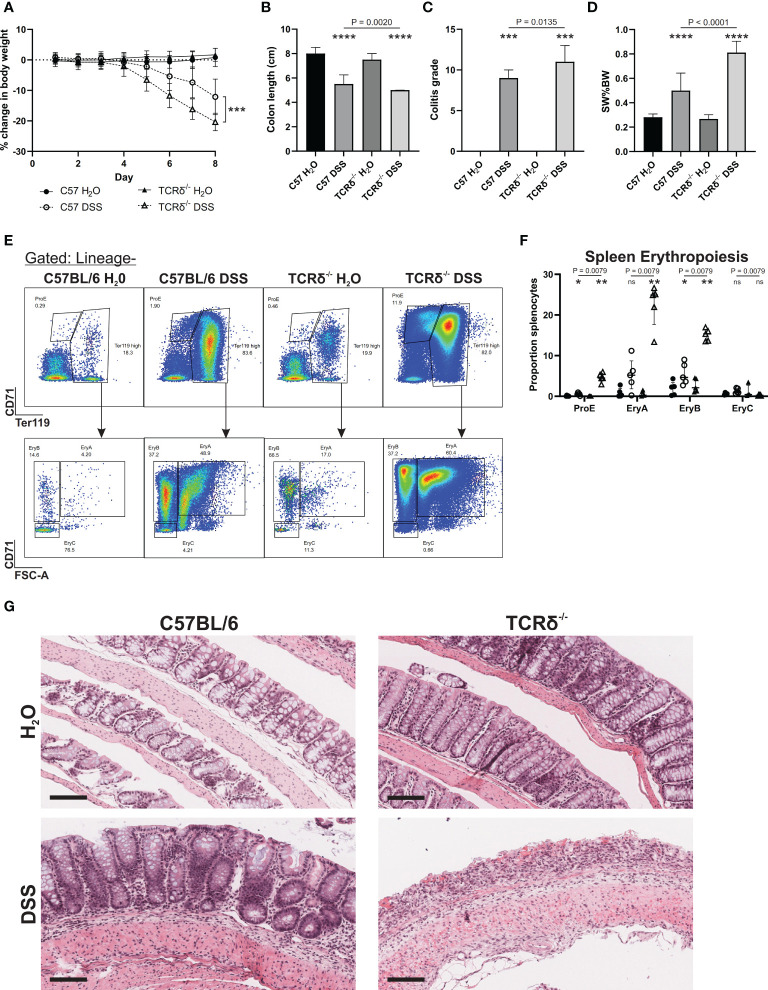
TCRδ-/- mice exhibit an increased susceptibility to DSS-induced colitis. (A) Percentage change in body weight from day 0 of C57BL/6 (circle) or TCRδ-/- mice (triangle) treated with either H2O (closed) or DSS (open). n = 18 – 30 mice per group. (B) Colon length (cm). n = 27 – 38 mice per group. (C) Histopathological colitis grade based on inflammation, epithelial injury, colitis activity, and lymphoid aggregates. n = 15 – 18 mice per group. (D) Spleen weight as a proportion of body weight (SW%BW). n = 18 – 26 mice per group. (E) Representative FACS plots showing erythropoiesis in spleen defined as ProE (CD71highTer119int), large ‘EryA’ erythroblasts (CD71highTer119highFSC-Ahigh), smaller, more mature ‘EryB’ erythroblasts (CD71highTer119highFSC-Alow), and mature ‘EryC’ erythroblast (CD71lowTer119highFSC-Alow) (37). Lineage = B220, CD11b CD62L, CD11b, Ly6G, Ly6C, F4/80. (F) Erythropoiesis as a proportion of splenocytes n = 5 mice per group. (G) Representative H&E-stained sections of Swiss rolls of colon from the indicated mice captured at 20x magnification. Scale bars = 100 μm. Representative of n = 15 – 18 mice per group. Data in B-E are presented as median ± IQR. ns, not significant; *p < 0.05; **p < 0.01; ***p < 0.001; ****p < 0.0001 by Mann-Whitney U test comparing water and DSS-treated mice of the same genotype.

