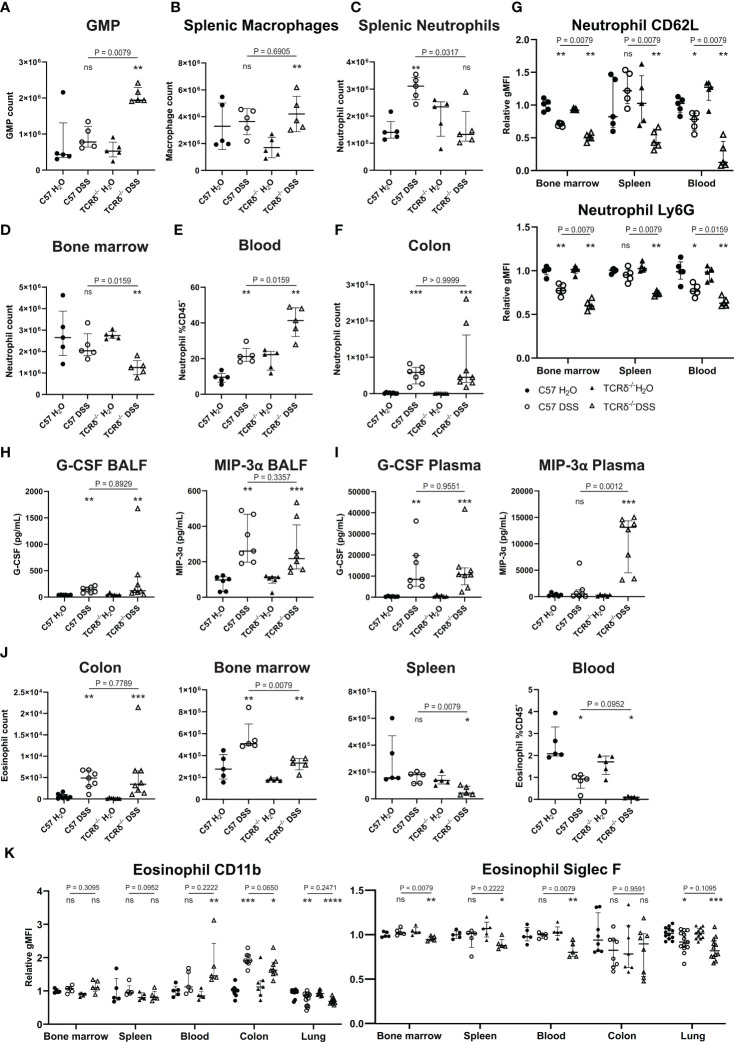
Figure 3.
Colitis in TCRδ-/- mice coincides with increases in neutrophil and neutrophil activation. (A) Total number of granulocyte/monocyte progenitors (GMPs) (CD45+Lin-Sca-1-cKit+CD16/32+) in spleen as determined by cell counts and flow cytometry from C57BL/6 (circle) or TCRδ-/- mice (triangle) treated with either H2O (closed) or DSS (open). n = 5 mice per group. (B) Total number of macrophages (CD45+CD11b-CD11c-F4/80+) in the spleen as determined by cell counts and flow cytometry. n = 5 mice per group. (C) Total number of neutrophils (CD45+CD11b+Ly6G+) in spleen as determined by cell counts and flow cytometry. n = 5 – 8 mice per group. (D) Total number of neutrophils (CD45+CD11b+Ly6G+) in bone marrow determined by cell counts and flow cytometry. n = 5 – 8 mice per group. (E) Proportion of neutrophils (CD45+CD11b+Ly6G+) in blood as determined by flow cytometry. n = 5 mice per group. (F) Total number of neutrophils (CD45+CD11b+Ly6G+) in colon as determined by cell counts and flow cytometry. n = 5 – 8 mice per group. (G) Geometric mean fluorescence intensity (gMFI) of CD62L and Ly6G on neutrophils relative to C57BL/6 water controls in bone marrow, spleen, and blood. n = 5 mice per group. (H) Cytokine concentrations (pg/mL) of G-CSF and MIP-3α in the BALF. n = 6 – 8 mice per group. (I) Cytokine concentrations (pg/mL) of G-CSF and MIP-3α in plasma. n = 6 – 8 mice per group. (J) Total number of eosinophils in colon, bone marrow, and spleen, and proportions of eosinophils in blood as determined by cell counts and flow cytometry. n = 5 – 8 mice per group. (K) gMFI of CD11b and Siglec F expression on eosinophils relative to C57BL/6 water controls in bone marrow, spleen, blood, colon, and lung. n = 4 – 12 mice per group. Data in A-G is presented as median ± IQR. ns, not significant; *p < 0.05; **p < 0.01; ***p < 0.001; ****p < 0.0001 by Mann-Whitney U test comparing water and DSS-treated mice of the same genotype.

