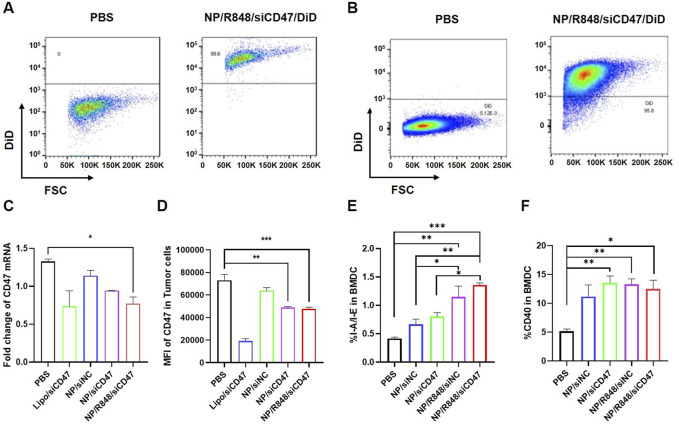
FIGURE 2.
Phagocytosis of NP/R848/siCD47/DiD by 4T1 cells and BMDCs induced in vitro. (A,B) Representative flow cytometry demonstrating the DiD fluorescence in 4T1 cells and BMDCs induced in vitro after being cultured with PBS and NP/R848/siCD47/DiD for 2 h. (C) mRNA levels of CD47 in 4T1 cells after incubation with PBS, NP/siNC, NP/siCD47, and NP/R848/siCD47 for 24 h were assayed by qPCR. (D) Flow cytometry analysis relative to MFI of the surface expression of CD47 on 4T1 cells upon treatment with PBS, NP/siNC, NP/siCD47, and NP/R848/siCD47 for 48 h. (E,F) Surface expression of CD40 and I-A/I-E in BMDCs measured by flow cytometry. Data were presented as mean ± SEM (n = 3). (*, p < 0.05; **, p < 0.01; ***, p < 0.001).

