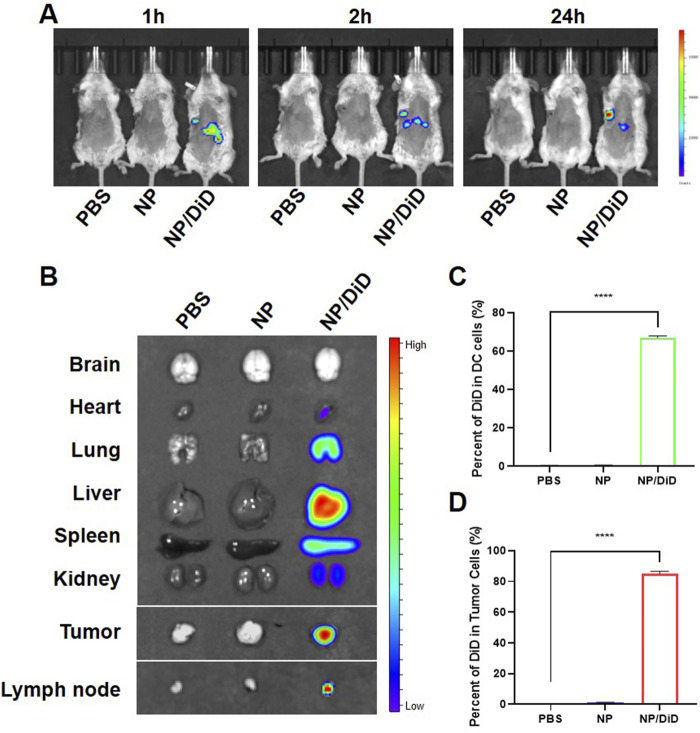
FIGURE 3.
Biodistribution of drug-loaded nanoparticles in tumor-bearing mice. (A) In vivo fluorescent imaging of tumor-bearing mice after intravenous injection of NP/R848/siCD47/DiD at different time points. (B) Ex vivo fluorescent imaging of the tumor and other organs. (C,D) Percentage of DiD+ cells in DCs and CD45− tumor cells isolated from mice injected with PBS, NP/R848/siCD47, or NP/DiD. Data were presented as mean ± SEM (n = 3). ****, p < 0.0001 by multiple one-way ANOVA.

