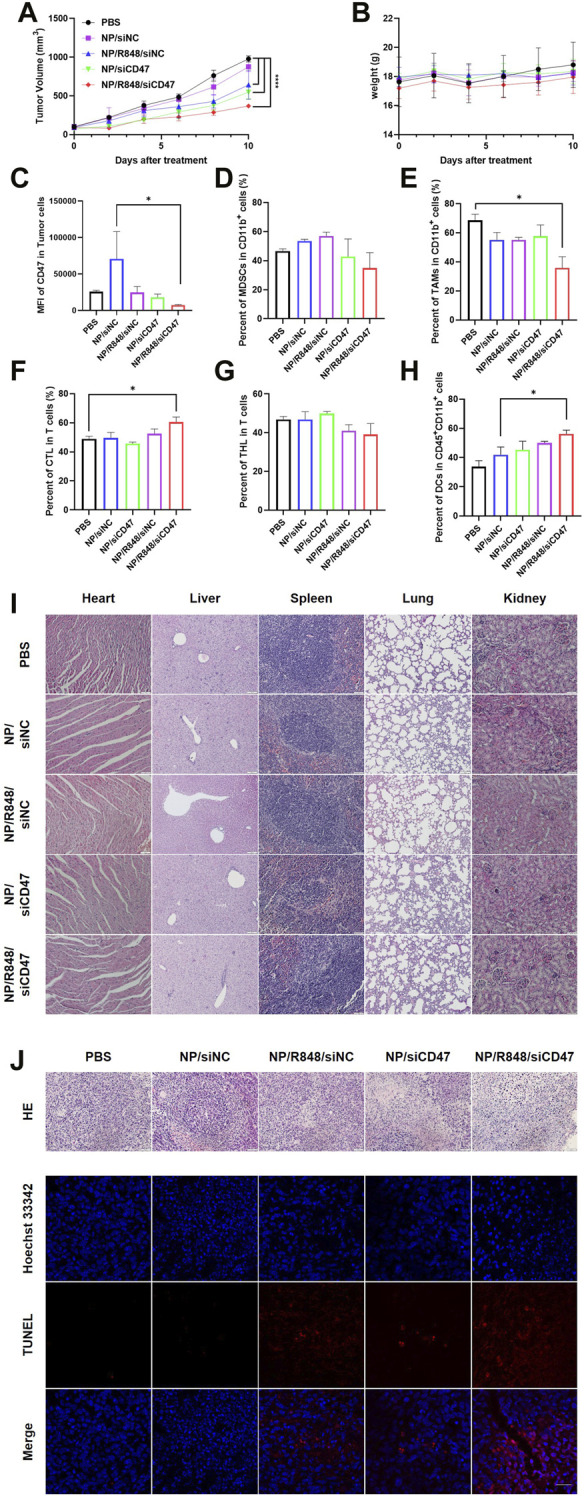
FIGURE 4.

NP/R848/siCD47 significantly inhibited tumor growth and enhanced anti-tumor immune responses in vivo. (A) Tumor growth curves of different groups of mice after various treatments (B) Body weights of 4T1 tumor-bearing mice in the tumor inhibition experiment of different groups of mice after various treatments. (C) Flow cytometry analysis of CD47 expression in tumor tissues treated with PBS, NP/siNC, NP/siCD47, NP/R848/siNC, and NP/R848/siCD47 at the end of the tumor-inhibition experiment. (D) Percentage of myeloid-derived suppressor cells (MDSCs) (CD11b+Gr-1+). (E) Percentage of tumor-associated macrophages (TAMs) (CD11b+F4/80+). (F,G) Percentage of cytotoxic T cells (CD3+CD8+) and helper T cells (CD3+CD4+). (H) Percentage of DCs (CD11b+CD11c+) in CD45+CD11b+ myeloid immune cells. (I) Microscopic image of HE staining of the main organ paraffin section. The scale bar is shown in the figure. (J) Microscopic image of HE staining of the tumor tissue paraffin section. The scale bar is shown in the figure. Fluorescence diagram of the TUNEL assay in tumor tissues treated as described in (C). The scale bar is 20 μm. Data were presented as mean ± SEM (n = 3). (*, p < 0.05; **, p < 0.01; ***, p < 0.001; ****, p < 0.0001).
