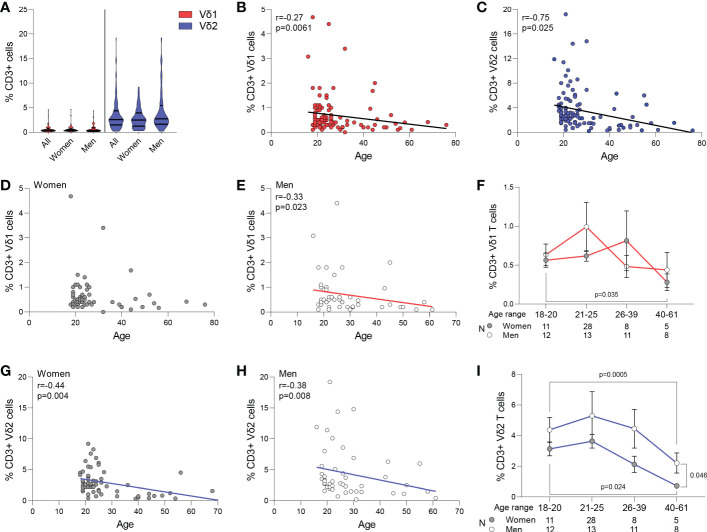
Figure 1.
Frequency of Vδ1 and Vδ2 T cells. Circulating frequency of γδ T cell populations in 108 healthy blood donor volunteers. (A) Violin plots show frequency of Vδ1 and Vδ2 T cells in the entire study cohort, with no differences between women and men. A median of 0.4% (range 0-4.4) were Vδ1 T cells, and a median of 2.6% (range 0.3-19.20) were Vδ2 T cells (p<0.001). Correlation of age with frequency of (B) Vδ1 and (C) Vδ2 T cells. (D) Vδ1 T cells frequency was maintained with aging in women and (E) decreased in men. (F) Frequencies of Vδ1 T cells between women and men in different ranges of age. Mean ± SEM is shown. Frequency of Vδ2 T cells decreased with age in both (G) women and (H) men. (I) Vδ2 T cell numbers decreased in both women and men, with a more pronounced decay in women after 40 years of age compared to men Mean ± SEM is shown. Vδ1 T cells are represented in red, Vδ2 T cells are represented in blue. Women are represented as filled circles and men as open circles. Correlation analysis by Spearman’s test.

