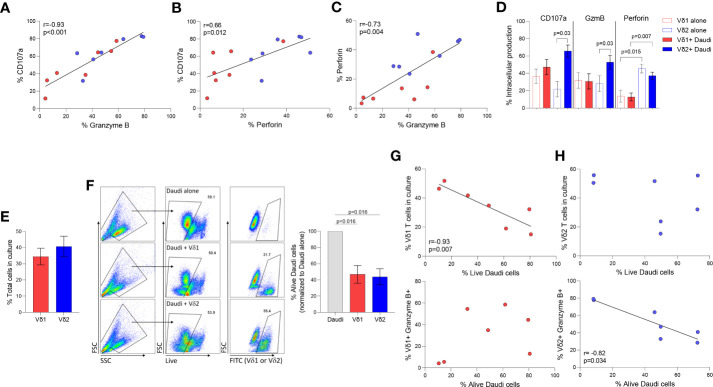
Figure 3.
Cytotoxic function of γδ T cell subsets. Daudi Burkitt’s lymphoma cell line was used to compare Vδ1 and Vδ2 T cells cytolytic function in seven healthy donor volunteers. Correlation between different intracellular markers upon coculture of Vδ1 (red) and Vδ2 (blue) T cells and Daudi cells, (A) CD107 and GzmB, (B) CD107a and perforin, and (C) Perforin and GzmB. (D) Expression of CD107a, GzmB and perforin in Vδ1 and Vδ2 T cells. (E) Comparison of the total number of Vδ1 and Vδ2 T cells during co-culture with Daudi cells (). (F) Comparison of Daudi cell killing capacity of Vδ1 or Vδ2 T cells. Correlation of killing capacity with (G) Vδ1 T cells’ frequency in culture, and GzmB production. Correlation of killing capacity with (H) Vδ2 T cells’ frequency in culture and GzmB production (rs=-0.82, p=0.034). Mean ± SEM is shown. Daudi cell killing analyzed by Wilcoxon matched-pairs rank test. Correlations by Spearmans’ test.

