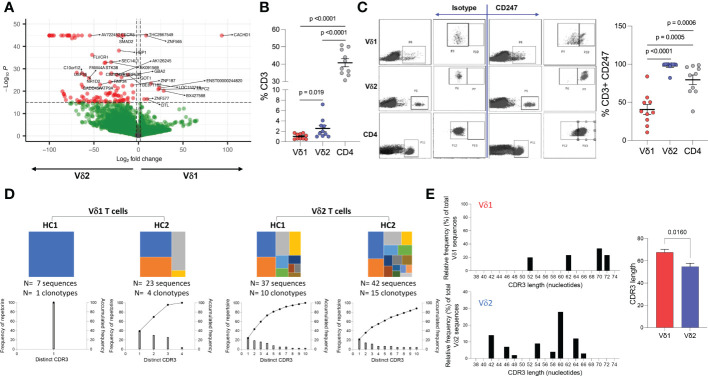
Figure 4.
Whole genome and TCR sequencing. Ex vivo whole genome microarray data analysis of highly purified resting Vδ1 and Vδ2 T cells from four healthy donor volunteers. (A) Volcano plot displaying differentially expressed genes in Vδ1 and Vδ2 T cells (p<0.01 cut-off and 2-fold differential signal intensities). (B) Frequencies of Vδ1, Vδ2, and CD4 T cell amongst total CD3+ T cells in 10 donors used to corroborate (C) the differences in CD247 gene expression differences at the protein level by flow cytometry. (D) TCR repertoire sequencing in two healthy donor volunteers showing unique clonotypes as a proportion of the total repertoire (top panels). Lower graphs represent TCR occupancy of the top ten most frequent clonotypes. (E) Relative differences in CDR3 length usage amongst Vδ1 and Vδ2 clonotypes.

