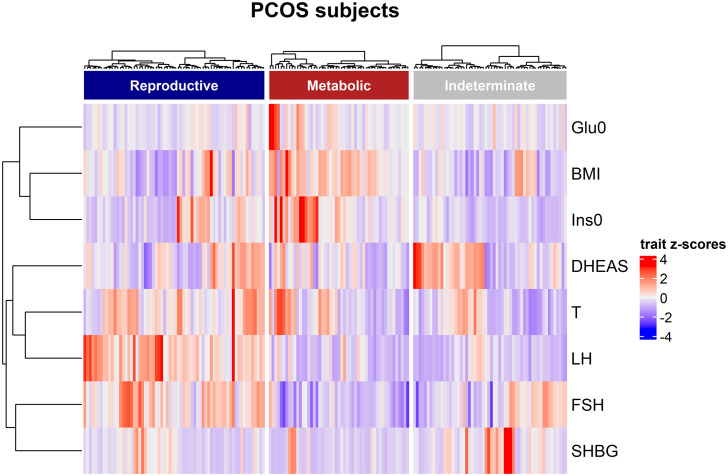
Figure 1.
Hierarchical clustering of genotyped PCOS clustering cohort. The three clusters are shown as dark blue, dark red, and grey color bars. Heatmap colors correspond with the trait Z-scores, as shown to the right side, in which red implies high values and blue indicates low values for each trait. The trait-based dendrogram represents relative distances between the trait distributions and was calculated using the same approach as that for the subject-based clustering.

