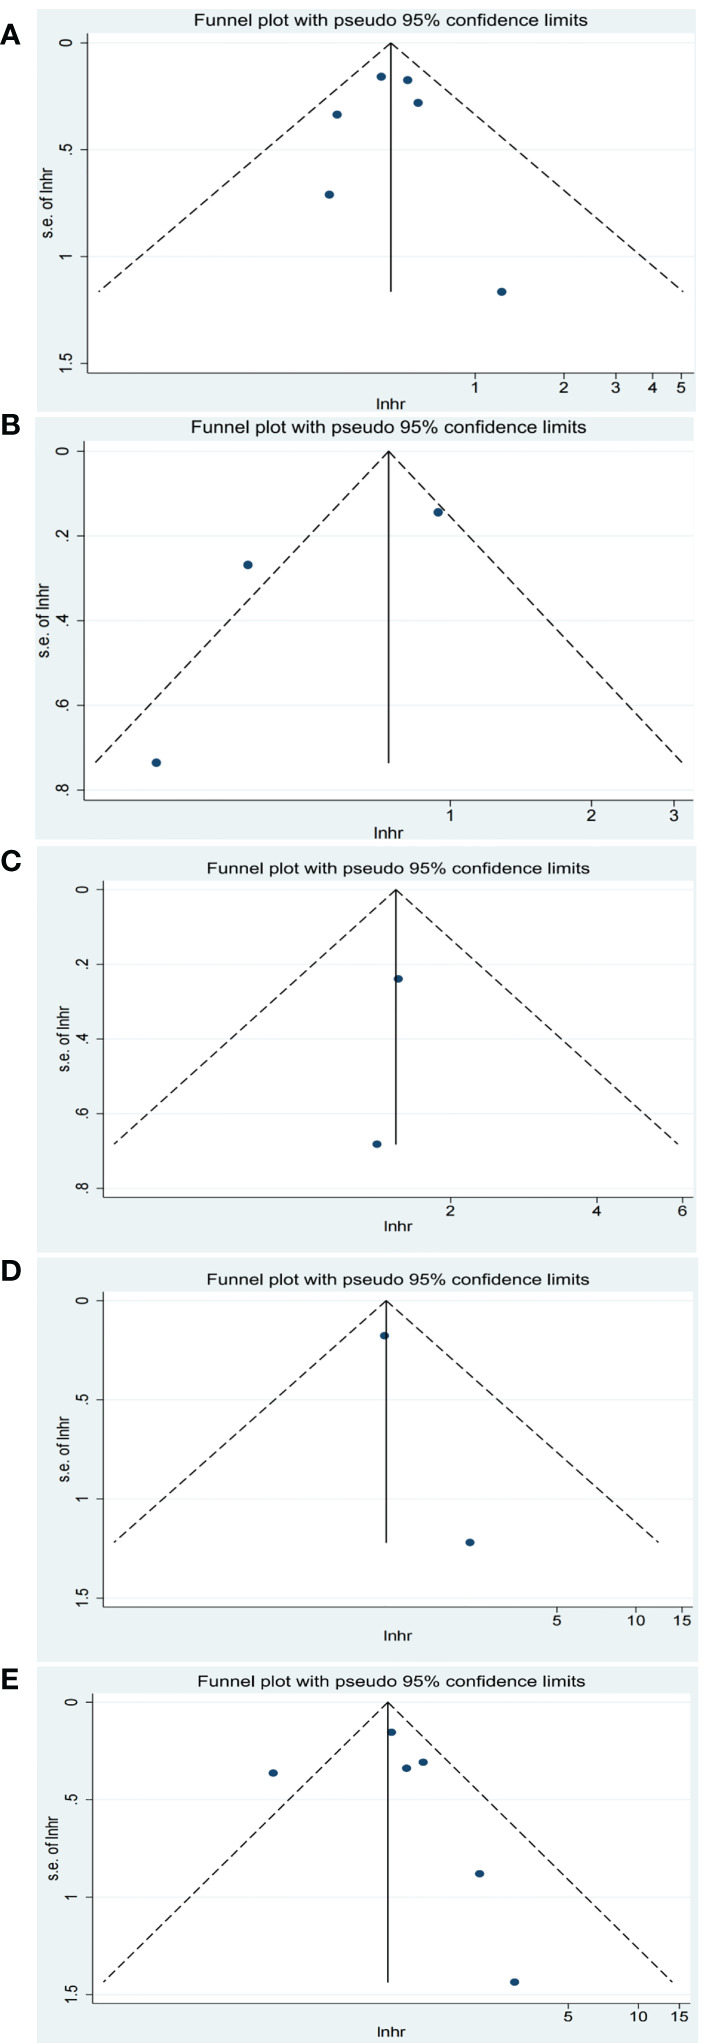
Figure 5.

Funnel plot of progression-free survival (PFS) for studies reporting biomarkers. (A) baseline plasma EBV DNA level; (B) dynamic plasma EBV DNA load during immunotherapy; (C) programmed cell death-ligand 1 (PD-L1) expression (higher vs. lower); (D) PD-L1 expression (positive vs. negative); (E) tumor mutation burden (TMB).
