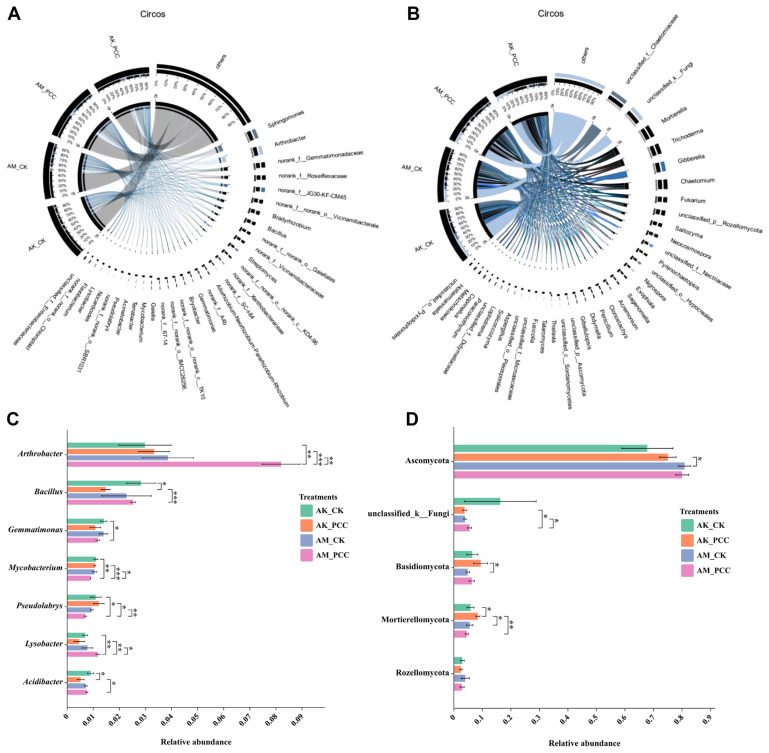
Fig. 4.
Distribution of the most dominant bacterial (A) and fungal (B) communities at the genus level under the different treatments. The bar plots for some bacterial (C) and fungal (D) genera showed significant differences among treatments according to a t test (P < 0.05). Asterisks represent significant differences at *P < 0.05, **P < 0.01, and ***P < 0.001. AK_CK, A. konjac inoculated with sterile water; AM_CK, A. muelleri inoculated with sterile water; AM_PCC, A. muelleri inoculated with Pectobacterium carotovorum subsp. carotovorum (Pcc); AK_PCC, A. konjac inoculated with Pcc.

