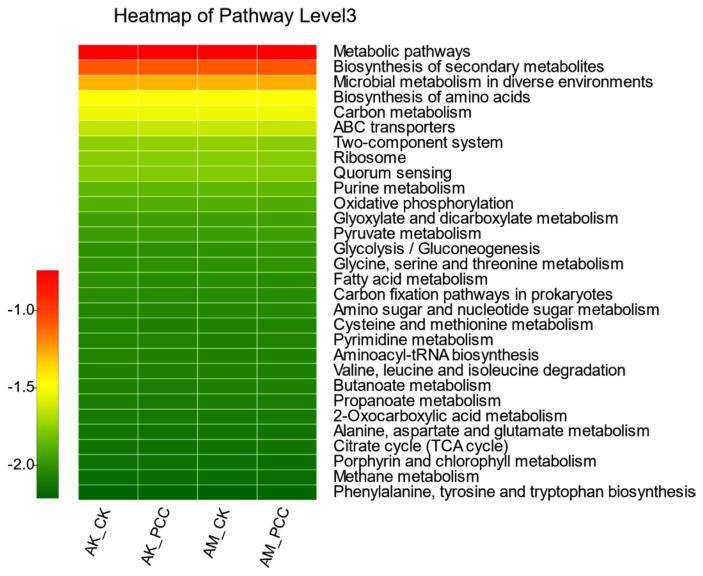
Fig. 6.
Heatmap of the relative abundances of the top 30 PICRUSt-predicted genes in the different treatments (n = 3/treatment). The abscissa is the treatment, and the ordinate is the function name of pathway level 3. The color gradients of the different color blocks represent the changes in different functional abundances in the treatments. The legend is the value represented by the color gradient. AK_CK, A. konjac inoculated with sterile water; AM_CK, A. muelleri inoculated with sterile water; AM_PCC, A. muelleri inoculated with Pectobacterium carotovorum subsp. carotovorum (Pcc); AK_PCC, A. konjac inoculated with Pcc.

