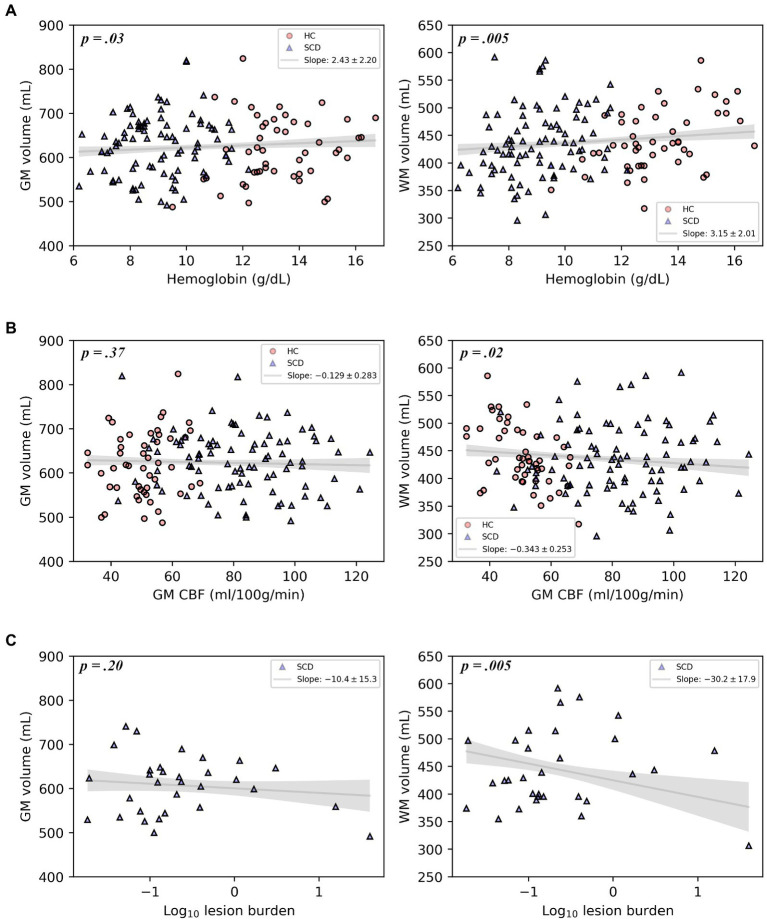
Figure 3.
Plots of gray matter volume and white matter volume with hemoglobin, gray matter CBF, or log-transformed infarct (lesion) burden, displaying the multivariable regression model-predicted association between each covariate and volume, controlling for age, sex, and intracranial volume, with 95% confidence intervals (gray line and shaded area). Models include healthy controls and participants with SCD (A,B) or participants with SCD and silent cerebral infarcts only (C). Overlaid on the model predictions are the raw data.

