. 2023 Jan 31;307(2):e220869. doi: 10.1148/radiol.220869

Figure 2:

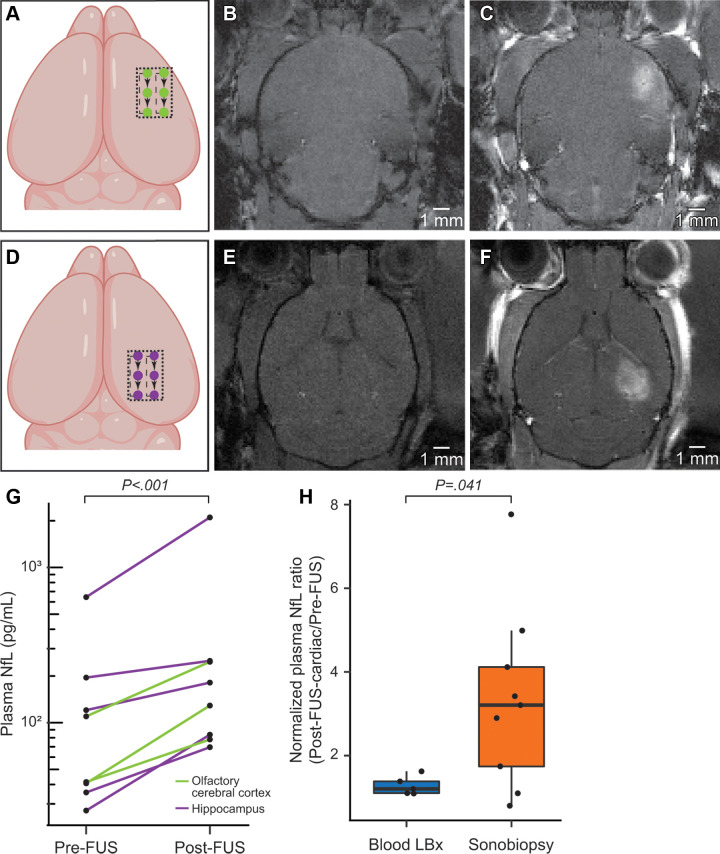
Sonobiopsy enhanced levels of plasma neurofilament light chain protein (NfL) in 6-month-old PS19 mice (experiment 2). (A) Schematic of the focused ultrasound trajectory targeting the olfactory cerebral cortex (piriform cortex and amygdala). (B) T1-weighted MRI scans were acquired before focused ultrasound and intravenous contrast material administration. (C) Post-focused ultrasound and postcontrast T1-weighted MRI scans enabled confirmation of focused ultrasound-induced blood-brain barrier (BBB) disruption as a signal enhancement. (D) Schematic of the focused ultrasound trajectory targeting the hippocampus. (E) T1-weighted MRI scans were acquired before focused ultrasound and intravenous contrast material administration. (F) Post-focused ultrasound and postcontrast T1-weighted MRI scans enabled confirmation of focused ultrasound–induced BBB disruption as a signal enhancement. There was no significant difference (P = .17) in the volume of focused ultrasound–mediated BBB disruption between mice treated at the olfactory cerebral cortex (mean, 21.74 mm3 ± 5.81) or the hippocampus (mean, 15.42 mm3 ± 5.83). (G) Sonobiopsy resulted in a 2.3-fold increase in plasma NfL levels (n = 8, P < .001). (H) The normalized plasma NfL (post-focused ultrasound–to–pre-focused ultrasound ratio) was significantly greater (P = .041) in the sonobiopsy group (n = 9, 3.34 ± 2.15) than the blood LBx group (control group without focused ultrasound treatment, n = 5; 1.28 ± 0.22). Black bar indicates median.

Sonobiopsy enhanced levels of plasma neurofilament light chain protein (NfL) in 6-month-old PS19 mice (experiment 2). (A) Schematic of the focused ultrasound trajectory targeting the olfactory cerebral cortex (piriform cortex and amygdala). (B) T1-weighted MRI scans were acquired before focused ultrasound and intravenous contrast material administration. (C) Post-focused ultrasound and postcontrast T1-weighted MRI scans enabled confirmation of focused ultrasound-induced blood-brain barrier (BBB) disruption as a signal enhancement. (D) Schematic of the focused ultrasound trajectory targeting the hippocampus. (E) T1-weighted MRI scans were acquired before focused ultrasound and intravenous contrast material administration. (F) Post-focused ultrasound and postcontrast T1-weighted MRI scans enabled confirmation of focused ultrasound–induced BBB disruption as a signal enhancement. There was no significant difference (P = .17) in the volume of focused ultrasound–mediated BBB disruption between mice treated at the olfactory cerebral cortex (mean, 21.74 mm3 ± 5.81) or the hippocampus (mean, 15.42 mm3 ± 5.83). (G) Sonobiopsy resulted in a 2.3-fold increase in plasma NfL levels (n = 8, P < .001). (H) The normalized plasma NfL (post-focused ultrasound–to–pre-focused ultrasound ratio) was significantly greater (P = .041) in the sonobiopsy group (n = 9, 3.34 ± 2.15) than the blood LBx group (control group without focused ultrasound treatment, n = 5; 1.28 ± 0.22). Black bar indicates median.