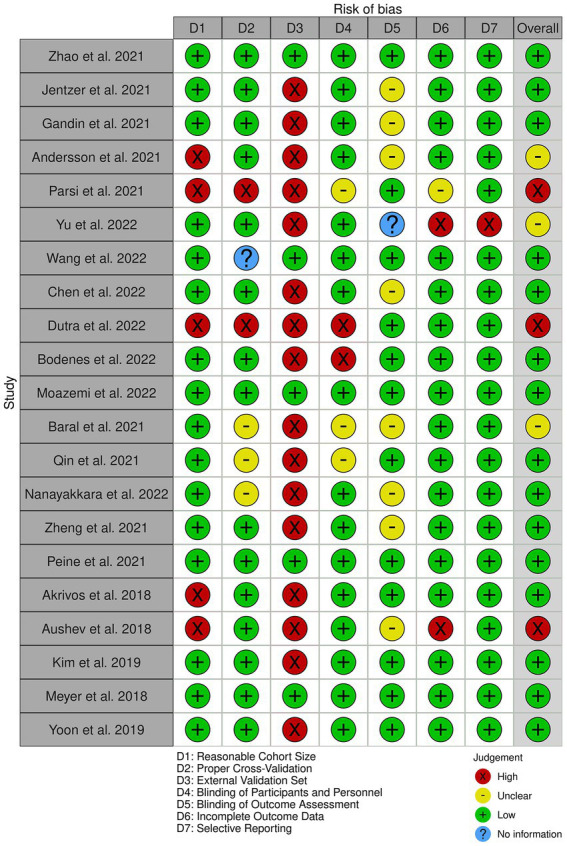
Figure 2.

The risk of bias diagram for the selected studies. Each row corresponds to a selected study. The columns D1–D7 correspond to different risk criteria. The subjective judgements are color-coded as explained in the legend. The final column represents the overall judgement for the corresponding study.
