. 2023 Jan 31;307(2):e221373. doi: 10.1148/radiol.221373

Figure 5:

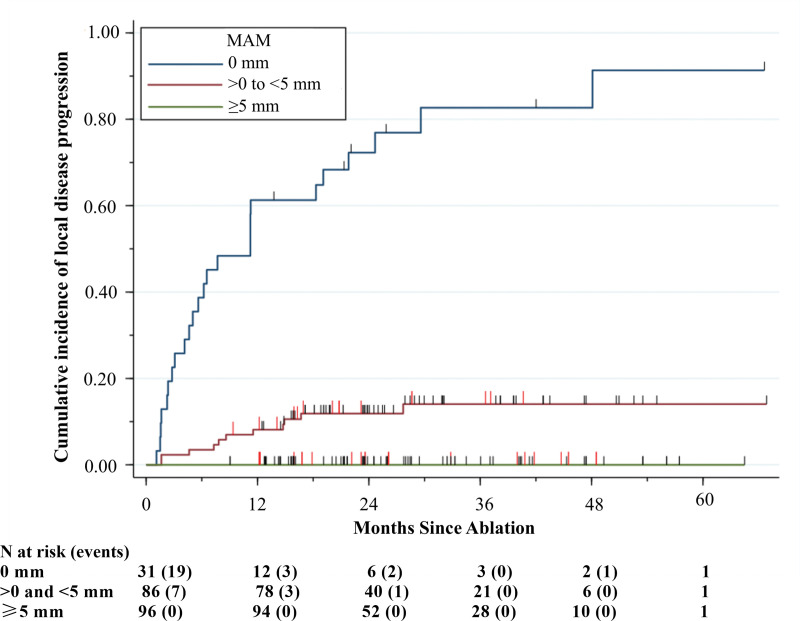
Cumulative incidence curve shows the per-tumor cumulative incidence of local disease progression over time stratified by the three-dimensional minimal ablative margin (MAM). Vertical red lines indicate death events and vertical black lines indicate censoring, with death as a competing risk.

Cumulative incidence curve shows the per-tumor cumulative incidence of local disease progression over time stratified by the three-dimensional minimal ablative margin (MAM). Vertical red lines indicate death events and vertical black lines indicate censoring, with death as a competing risk.