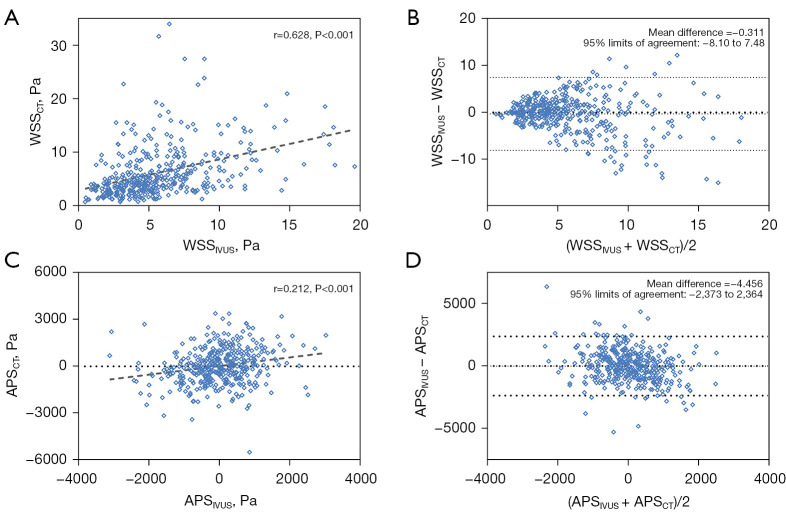
Figure 3.
Comparison of CCTA-derived parameters versus IVUS/ICA. (A,B) Scatterplot and Bland-Altman plot for CCTA-derived WSS versus IVUS/ICA. (C,D) Scatterplot and Bland-Altman plot for CCTA-derived APS versus IVUS/ICA. APS, axial plaque stress; CT, computed tomography; CCTA, coronary computed tomography angiography; IVUS, intravascular ultrasound; ICA, intravascular coronary angiography; WSS, wall shear stress.

