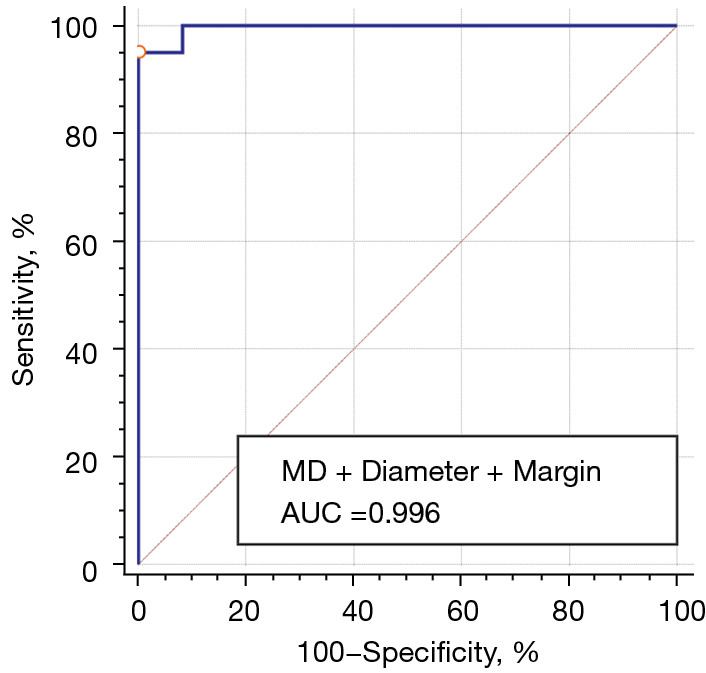
Figure 5.

ROC curve of the diagnostic performance of the combined predictor of MD, diameter, and margin in identifying PTC. The AUC was 0.996 (95% CI: 0.945–1.000). The optimal cutoff value was 0.69 (sensitivity 95.1%, specificity 100.0%). MD, mean diffusivity; AUC, area under the curve; ROC, receiver operating characteristic; PTC, papillary thyroid carcinoma; CI, confidence interval.
