. 2023 Feb 3;29(8):1440–1449. doi: 10.1158/1078-0432.CCR-22-2939

Figure 3.

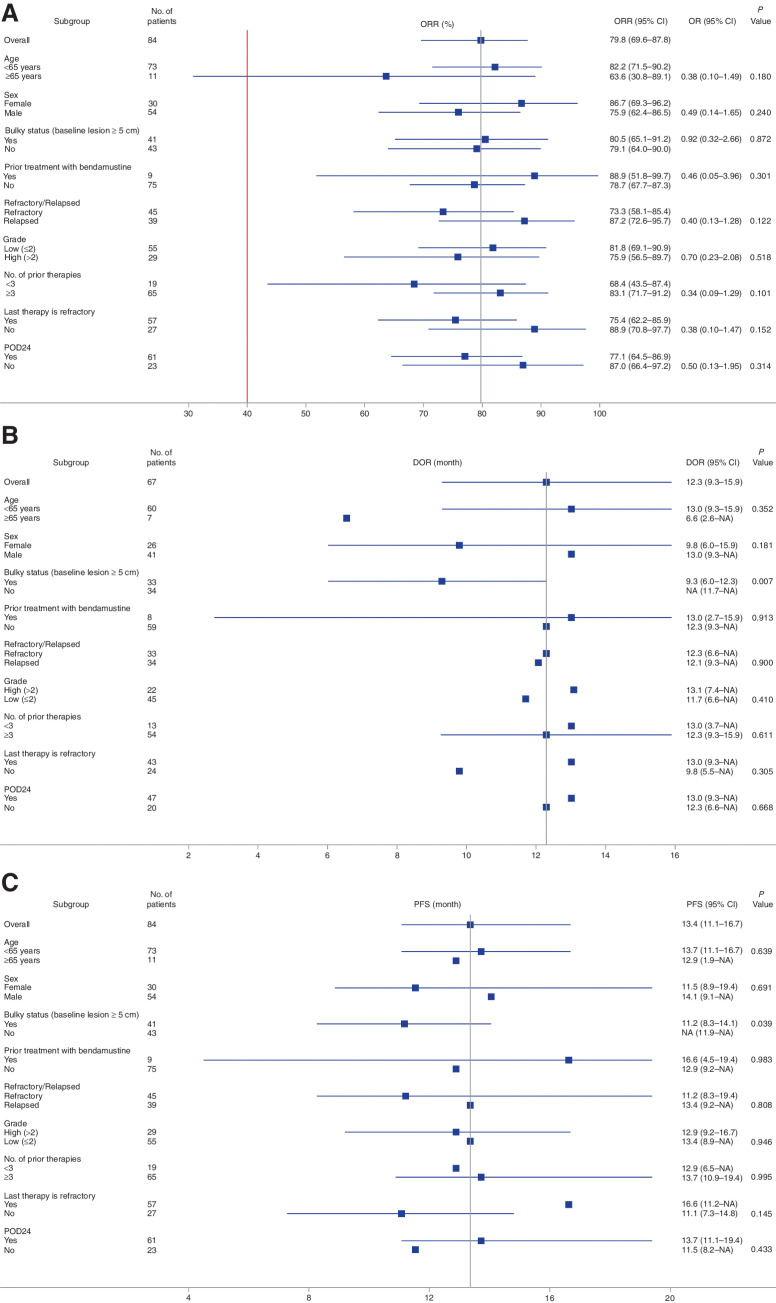
Figure 3. Subgroup analysis of ORR, DOR, and PFS confirmed by IRC assessment for patient with FL demographic and baseline criteria. Forest plots for a variety of relapsed and/or refractory patient with FL characteristics are shown for the linperlisib phase II study. A, ORR, (B) DOR, and (C) PFS. Vertical line represents the median value for ORR, DOR, and PFS for all patients. P values and odds ratio (ORR only) are shown as calculated between the two subgroups for any parameter displayed. Note: In cases where patients had a censor endpoint, the confidence interval were unable to be calculated, and only the median value is displayed for that subgroup evaluation.

Subgroup analysis of ORR, DOR, and PFS confirmed by IRC assessment for patients with FL demographic and baseline criteria. Forest plots for a variety of relapsed and/or refractory patients with FL characteristics are shown for the linperlisib phase II study. ORR (A), DOR (B), and PFS (C). Vertical line represents the median value for ORR, DOR, and PFS for all patients. P values and odds ratio (ORR only) are shown as calculated between the two subgroups for any parameter displayed. Note: In cases where patients had a censor endpoint, the confidence intervals were unable to be calculated, and only the median value is displayed for that subgroup evaluation.