. 2023 Feb 2;29(8):1460–1467. doi: 10.1158/1078-0432.CCR-22-3027

Figure 3.

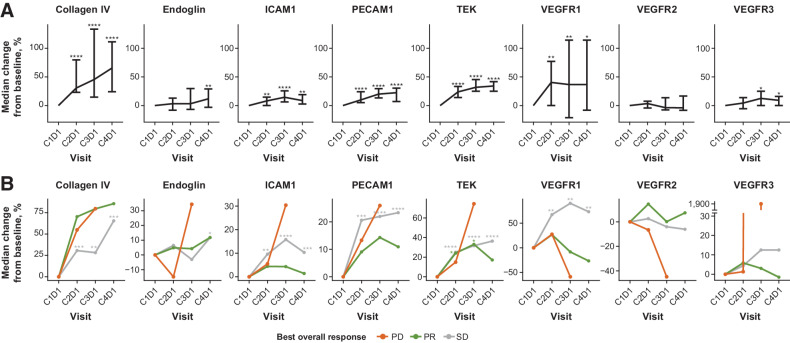
Figure 3. Pharmacodynamic Changes in Biomarkers Over Time (A); and Changes by Best Overall Response (B) in the Gastric Cancer Cohort. Serum samples were in 31 patients who had samples available at C2D1, C3D1, and C4D1; asterisks indicate results of 1-sample Wilcoxon signed-rank test results of P < 0.05 (*), P < 0.01 (**), P < 0.001 (***), or P < 0.0001 (****). C, cycle; D, day; ICAM, intercellular adhesion molecule; PECAM, platelet and endothelial cell adhesion molecule; TEK, TEK receptor tyrosine kinase.

Pharmacodynamic changes in biomarkers over time (A) and changes by best overall response (B) in the gastric cancer cohort. Serum samples were of 31 patients who had samples available at C2D1, C3D1, and C4D1; asterisks indicate results of 1-sample Wilcoxon signed-rank test results of P < 0.05 (*), P < 0.01 (**), P < 0.001 (***), or P < 0.0001 (****). In part A, vertical bars represent 95% CIs. C, cycle; D, day; PECAM, platelet and endothelial cell adhesion molecule.