. 2023 Feb 7;83(8):1203–1213. doi: 10.1158/0008-5472.CAN-22-2236

Figure 2.

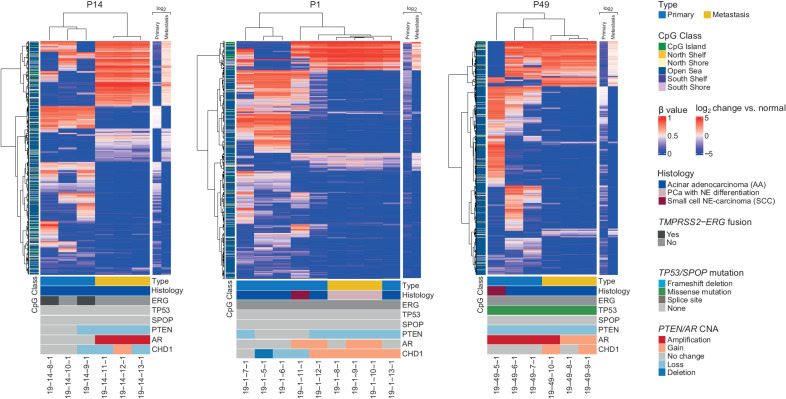
Figure 2. Intrapatient variation between selected primary and metastatic samples. The samples from each patient were clustered using the 1% most variably methylated CpG sites from the Illumina EPIC array (8,038 sites). Heatmap shows β values for primary and metastatic samples. Class of CpG (in relation to CpG island) is shown in blue/green heatmap on the left. Average log2 fold change of the primary tumors and metastases compared with normal prostate tissue are shown on the right. Sample type (primary or metastatic), histology, and genetic alterations from whole-exome sequencing are annotated below.

Intrapatient variation between selected primary and metastatic samples. The samples from each patient were clustered using the 1% most variably methylated CpG sites from the Illumina EPIC array (8,038 sites). Heatmap shows β values for primary and metastatic samples. Class of CpG (in relation to CpG island) is shown in blue/green heatmap on the left. Average log2-fold change of the primary tumors and metastases compared with normal prostate tissue is shown on the right. Sample type (primary or metastatic), histology, and genetic alterations from whole-exome sequencing are annotated below.