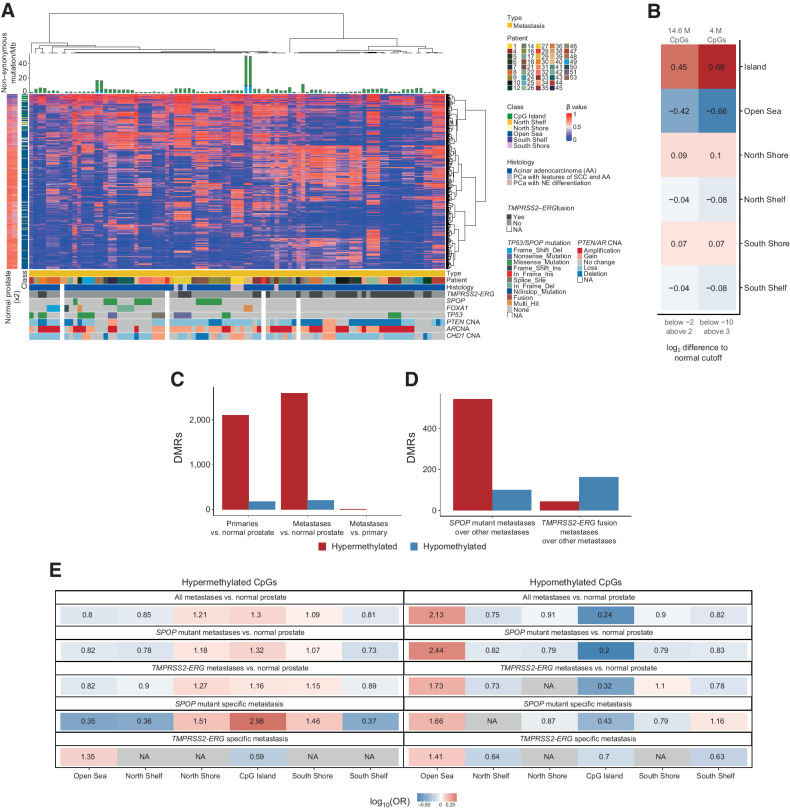
Figure 3.
SPOP-mutant and TMPRSS2-ERG fusion PCBM have distinct methylomes. A, Unsupervised hierarchical consensus clustering of metastatic samples from 42 patients. Samples from each patient were clustered using 1% most variably methylated CpG sites from the Illumina EPIC array (8,038 sites). The heatmap shows the β values. Class of CpG (in relation to CpG island) is shown in blue/green heatmap on the left, along with methylation status of CpG sites in normal prostate tissue. Mutational burden (mutations/Mb) is shown in the barplot on top. Sample type (primary or metastatic), histology, and genetic alterations from whole-exome sequencing are annotated below. B, Enrichment in CpG types among the variably methylated CpGs, showing CpGs with log2-fold difference to mean β value of normal prostates below −2 and above 2 (left column), and below −10 and above 3 (right column). Values and colors indicate Pearson correlation coefficients. P values were < 2.22 × 10⁻¹⁶ in all cases. C, Number of DMRs in primary cancers compared with normal prostate and metastases compared with normal prostate (DMR ≥ 5 CpGs, >|20%| change in methylation, q < 0.05). D, Number of DMRs in metastases with SPOP mutation versus samples with neither SPOP mutation nor TMPRSS2-ERG fusion and metastases with TMPRSS2-ERG fusion versus samples with neither SPOP mutation nor TMPRSS2-ERG fusion (DMR ≥ 5 CpGs, >|20%| change in methylation). E, Enrichment for differentially methylated CpGs between all metastases and normal prostate tissue, SPOP-mutant metastases and normal prostate tissue, TMPRSS2-ERG fusion metastases, and normal prostate tissue, SPOP-mutant metastases compared with non–TMPRSS2-ERG/SPOP-mutant metastases, and TMPRSS2-ERG fusion metastases compared with non–TMPRSS2-ERG/SPOP-mutant metastases. Values indicate the log-OR from Fisher exact tests.

