Figure 5.
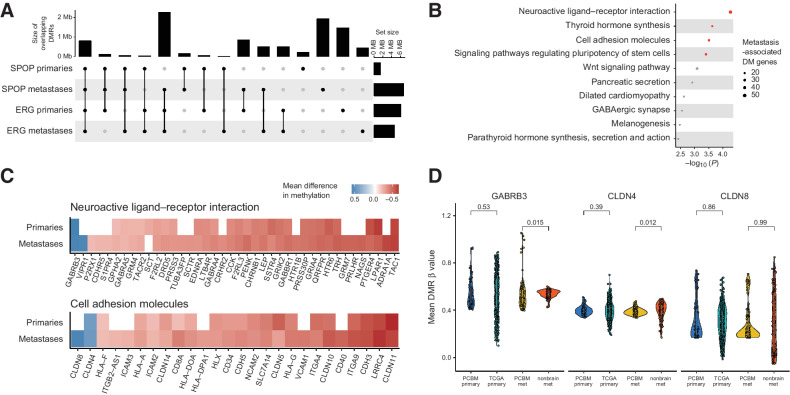
PCBM DNA methylation changes may suggest mechanisms driving PCBM. A, Overlap between DMRs in SPOP-mutant primaries, SPOP-mutant metastases, TMPRSS2-ERG fusion primaries, and TMPRSS2-ERG fusion metastases, compared with normal prostates. Dots and lines show sets being intersected, bar plots on top show the intersection size (Mb), and bar plots on the right show the size of set (Mb). B, Gene ontology analysis on genes with promoter-associated DMRs in PCBM compared with normal prostate tissue. C, Heatmap showing mean difference in methylation level at DM promoters of genes in the neuroactive ligand–receptor interaction and cell adhesion molecules gene sets for primary tumors and metastases, compared with normal prostates. White, the absence of a DMR at a given promoter. D, Mean level of methylation at promoter DMRs of GABRB3, CLDN4, and CLDN8 in primary samples from the PCBM cohort, TCGA primary prostate cancers, metastatic samples from the PCBM cohort, and nonbrain metastases from Zhao and colleagues (13). P values computed from Wilcoxon tests. PCBM primary, n = 57; TCGA primary, n = 502; PCBM metastasis, n = 95; nonbrain metastasis, n = 100.

