. 2023 Apr 14;83(8):1329–1344. doi: 10.1158/0008-5472.CAN-22-2794

Figure 1.

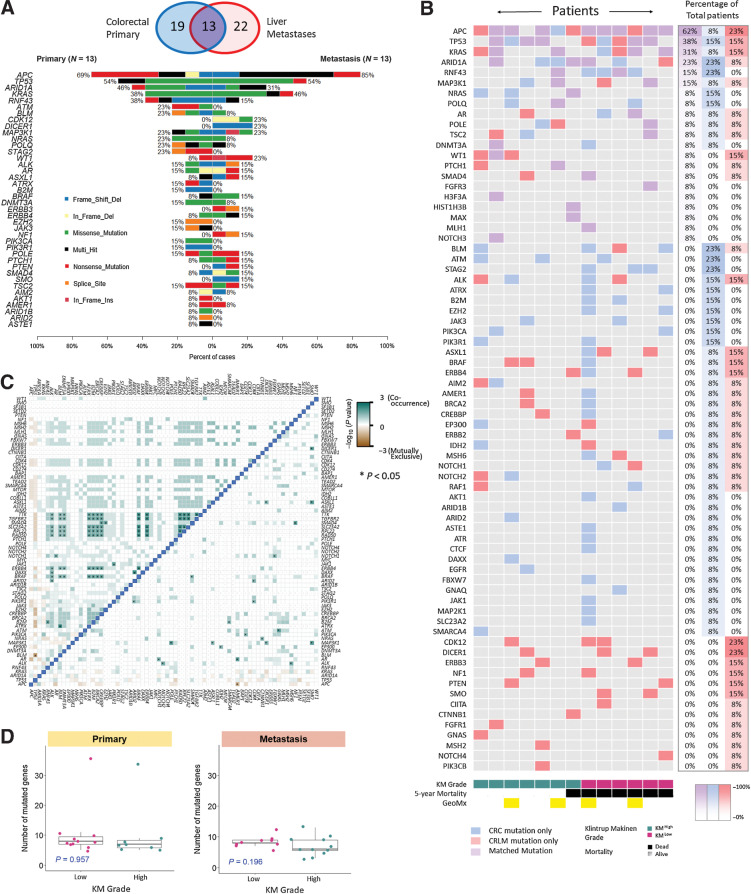
Figure 1. Mutational Characterization of primary colorectal cancer and CRLM. A, Venn diagram demonstrating primary colorectal cancer and CRLM that underwent genomic analysis. Co-Barplot illustrating most frequently mutated genes across 13 matched primary colorectal cancer and CRLM, including mutation type. Genes are ordered by mutational frequency. Sections were sequenced using GPOL (Glasgow Precision Oncology Laboratory) mutational panel. B, Oncoplot demonstrating concurrent mutations in the 13 matched lesions. Patients are ranked according to co-mutational burden on the y-axis and ranked according to KM grade on the x-axis. Blue denotes gene mutated in primary only, red denotes gene mutated in metastasis only, purple denotes mutated in primary and metastasis. The right hand 3 columns denote the percentage of total patients with each mutation type. C, Correlation matrix demonstrating co-occurrence of mutations with left of the blue demarcation line representing primary colorectal cancer, right of the blue demarcation line representing CRLM (pair-wise Fisher's Exact test *, P < 0.05). Gene names are displayed along the x and y-axes ordered by mutational frequency. Dark green boxes represent significant co-occurrence. D, Box plot illustrating mutational burden in primary colorectal cancer and CRLM according to KM grade using the Mann–Whitney test to assess for statistically significant difference between KM groups.

Mutational characterization of primary colorectal cancer and CRLM. A, Venn diagram demonstrating primary colorectal cancer and CRLM that underwent genomic analysis. Co-Barplot illustrating most frequently mutated genes across 13 matched primary colorectal cancer and CRLM, including mutation type. Genes are ordered by mutational frequency. Sections were sequenced using GPOL (Glasgow Precision Oncology Laboratory) mutational panel. B, Oncoplot demonstrating concurrent mutations in the 13 matched lesions. Patients are ranked according to co-mutational burden on the y-axis and ranked according to KM grade on the x-axis. Blue, gene mutated in primary only; red, gene mutated in metastasis only; purple, mutated in primary and metastasis. The right-hand three columns denote the percentage of total patients with each mutation type. C, Correlation matrix demonstrating co-occurrence of mutations, with left of the blue demarcation line representing primary colorectal cancer, right of the blue demarcation line representing CRLM (pair-wise Fisher exact test; *, P < 0.05). Gene names are displayed along the x- and y-axes ordered by mutational frequency. Dark green boxes represent significant co-occurrence. D, Box plot illustrating mutational burden in primary colorectal cancer and CRLM according to KM grade using the Mann–Whitney test to assess for statistically significant difference between KM groups.