. 2023 Apr 14;83(8):1329–1344. doi: 10.1158/0008-5472.CAN-22-2794

Figure 3.

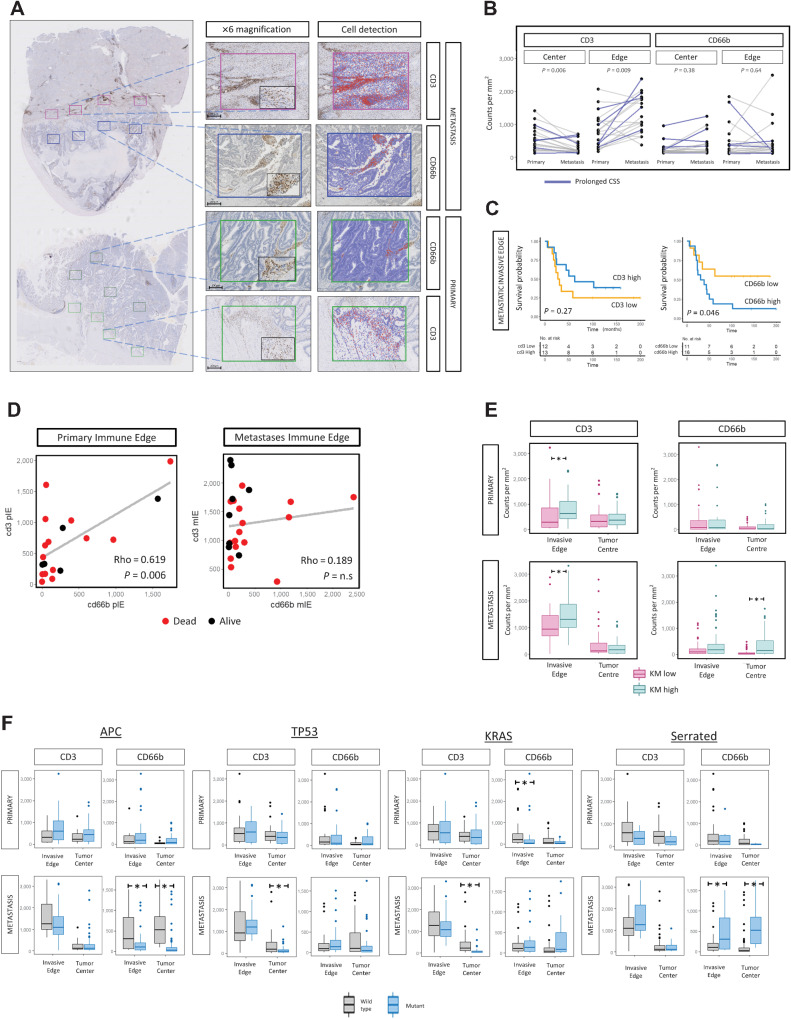
Figure 3. IHC characterization of matched primary colorectal cancer and CRLM with integration of morphological and mutational features. A, Representative images of CD3 and CD66b immunohistochemical staining (Patient B). Whole section demonstrated at ×0.5 magnifications, ROIs corresponding to tumor center (TC) and invasive edge (IE) of primary and CRLM shown at ×6 and ×10 (black box); scale bar, 100 μm. B, Intra-patient comparison between primary and metastasis of CD3 and CD66b cell counts at tumor center and invasive edge. P values calculated using the Mann–Whitney test. C, Kaplan–Meier survival plots (log-rank test, P values displayed) demonstrating the prognostic impact of CD3 and CD66b cell density at CRLM IE identified by IHC for IE of CRLM. High and low values determined according to median expression. D, Comparison of CD3 and CD66b cell density at (i) primary IE (ii) CRLM IE (iii) CD3 primary IE and metastatic TC. Spearman's Rho analysis. E, Box plots illustrating the relationship between KM grade and CD3 and CD66b cell counts at the IE and TC of primary colorectal cancer and CRLM. The P value was calculated using the Mann–Whitney test. F, Box-plot representing relationship between mutational features (APC, TP53, KRAS, Serrated) and CD3 and CD66b cell density at TC and IE of primary colorectal cancer and CRLM. The P value was calculated using the Mann–Whitney test. Lesions of serrated origin were defined as APCwild + KRAS/BRAFmutation.

IHC characterization of matched primary colorectal cancer and CRLM with integration of morphological and mutational features. A, Representative images of CD3 and CD66b immunohistochemical staining (Patient B). Whole section demonstrated at ×0.5 magnifications; ROIs corresponding to tumor center (TC) and invasive edge (IE) of primary and CRLM are shown at ×6 and ×10 (black box). Scale bar, 100 μm. B, Intrapatient comparison between primary and metastasis of CD3 and CD66b cell counts at tumor center and invasive edge. P values calculated using the Mann–Whitney test. C, Kaplan–Meier survival plots (log-rank test, P values displayed) demonstrating the prognostic impact of CD3 and CD66b cell density at CRLM IE identified by IHC for IE of CRLM. High and low values determined according to median expression. D, Comparison of CD3 and CD66b cell density at (i) primary IE, (ii) CRLM IE, and (iii) CD3 primary IE and metastatic TC. Spearman Rho analysis. E, Box plots illustrating the relationship between KM grade and CD3 and CD66b cell counts at the IE and TC of primary colorectal cancer and CRLM. The P value was calculated using the Mann–Whitney test. F, Box plot representing relationship between mutational features (APC, TP53, KRAS, Serrated) and CD3 and CD66b cell density at TC and IE of primary colorectal cancer and CRLM. The P value was calculated using the Mann–Whitney test. Lesions of serrated origin were defined as APCwild + KRAS/BRAFmutation.