. 2023 Apr 14;83(8):1329–1344. doi: 10.1158/0008-5472.CAN-22-2794

Figure 5.

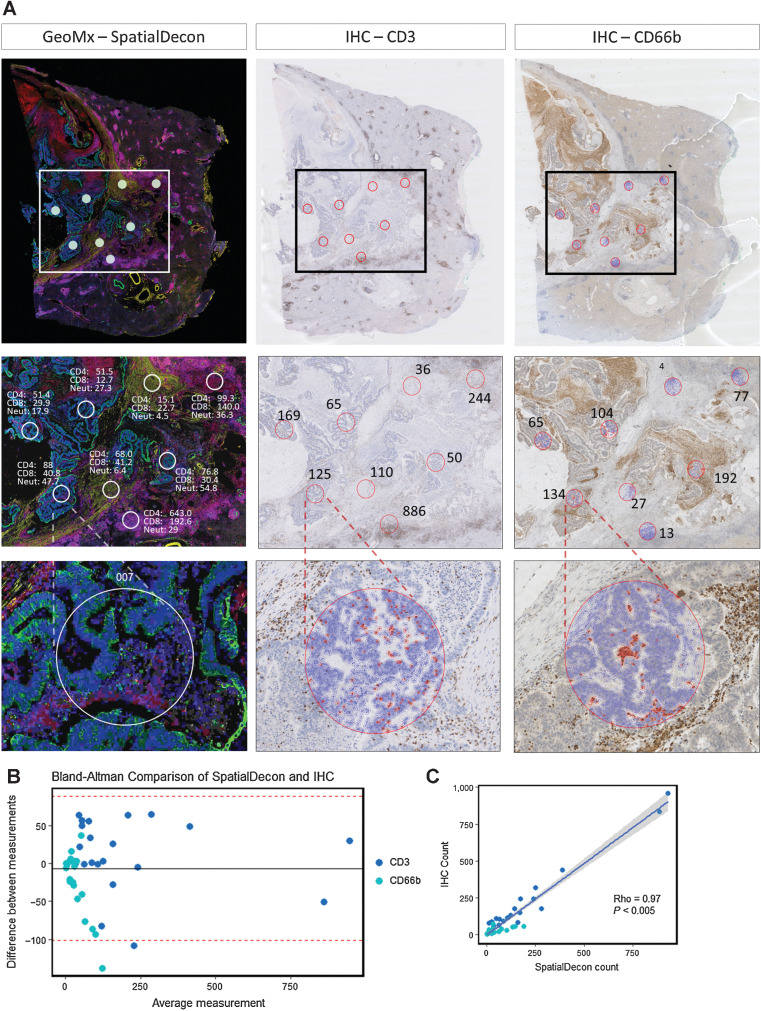
Figure 5. Immune cell spatial deconvolution. A, Representative images from 1 CRLM (Patient A, Fig. 4A) showing cell detection from the Qupath package used on a CD3 and CD66b IHC-stained liver metastasis to count number of CD3 and CD66b-positive cells from 21 regions from a total of 3 CRLM. This count was compared with the SpatialDecon-derived count that uses the transcriptomic data from the corresponding ROI in the GeoMx mIF-stained matched sample (See Supplementary Fig. S5). B, Bland Altman plot comparing transcriptome SpatialDecon-derived cell count versus the IHC-derived cell count. C, Correlation plot comparing transcriptome SpatialDecon-derived cell count versus the IHC-derived cell count.

Immune cell spatial deconvolution. A, Representative images from 1 CRLM (Patient A, Fig. 4A) showing cell detection from the Qupath package used on a CD3 and CD66b IHC-stained liver metastasis to count number of CD3 and CD66b-positive cells from 21 regions from a total of three CRLM. This count was compared with the SpatialDecon-derived count that uses the transcriptomic data from the corresponding ROI in the GeoMx mIF-stained matched sample (See Supplementary Fig. S5). B, Bland Altman plot comparing transcriptome SpatialDecon-derived cell count versus the IHC-derived cell count. C, Correlation plot comparing transcriptome SpatialDecon-derived cell count versus the IHC-derived cell count.