. 2023 Apr 14;83(8):1329–1344. doi: 10.1158/0008-5472.CAN-22-2794

Figure 6.

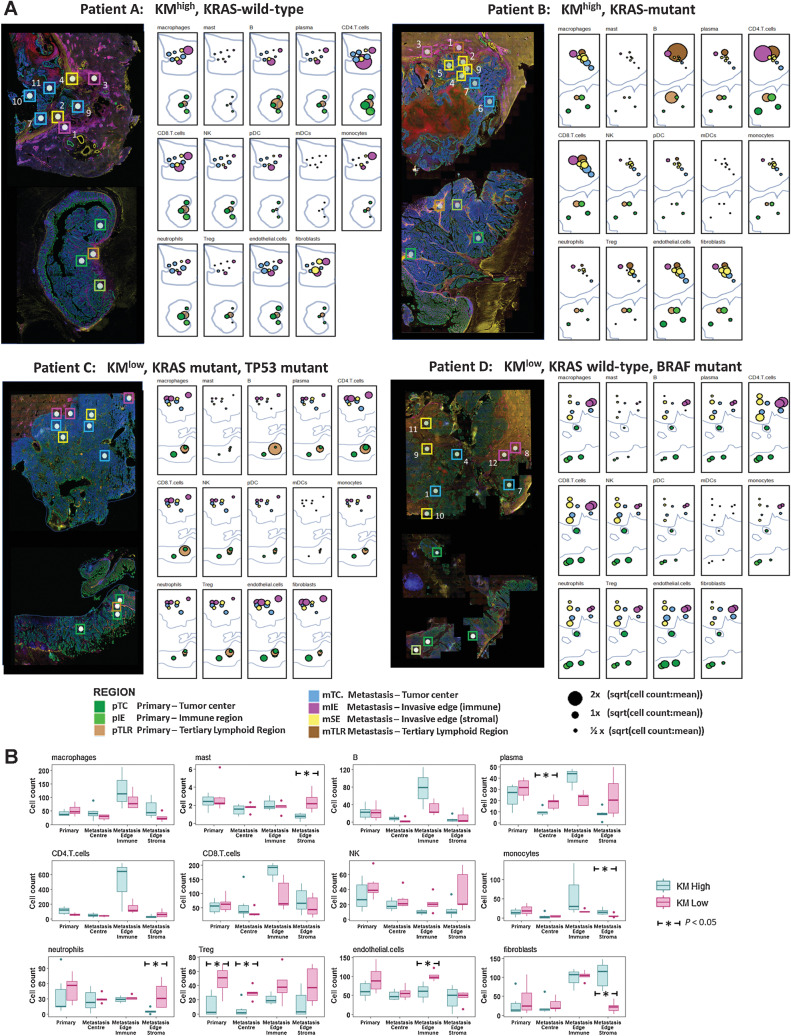
Figure 6. Topographic immune cell deconvolution primary colorectal cancer and CRLM. A, Images (from Fig. 4A) of primary colorectal cancer (bottom) and CRLM (top) with 48 ROIs superimposed. Abundance estimates as determined from transcriptome by SpatialDecon for 14 cell populations illustrated for each ROI with color-coding detailing the annotated tumor region. Radius is proportional to the estimated cell counts within the ROI. The immune cell count per region was extracted and the square root of the ratio to the mean immune cell count per region (41.37) of all immune cells was calculated and displayed. The square root of the ratio was calculated to minimize the skew caused by variance of highly expressed cell types. B, Box plots demonstrating the median and interquartile range for each cell type analyzed organized by cell type and topographic region and grouped by KM grade. All ROI taken from primary colorectal cancer except TLR are grouped as Primary. Dendritic cells were removed due to insignificant counts. The Mann–Whitney test used to assess for statistical significance; *, P < 0.05.

Topographic immune cell deconvolution primary colorectal cancer and CRLM. A, Images (from Fig. 4A) of primary colorectal cancer (bottom) and CRLM (top) with 48 ROIs superimposed. Abundance estimates as determined from transcriptome by SpatialDecon for 14 cell populations illustrated for each ROI with color coding detailing the annotated tumor region. Radius is proportional to the estimated cell counts within the ROI. The immune cell count per region was extracted and the square root of the ratio to the mean immune cell count per region (41.37) of all immune cells was calculated and is displayed. The square root of the ratio was calculated to minimize the skew caused by variance of highly expressed cell types. B, Box plots demonstrating the median and interquartile range for each cell type analyzed organized by cell type and topographic region and grouped by KM grade. All ROIs taken from primary colorectal cancer except TLR are grouped as primary. Dendritic cells were removed due to insignificant counts. The Mann–Whitney test was used to assess for statistical significance; *, P < 0.05.