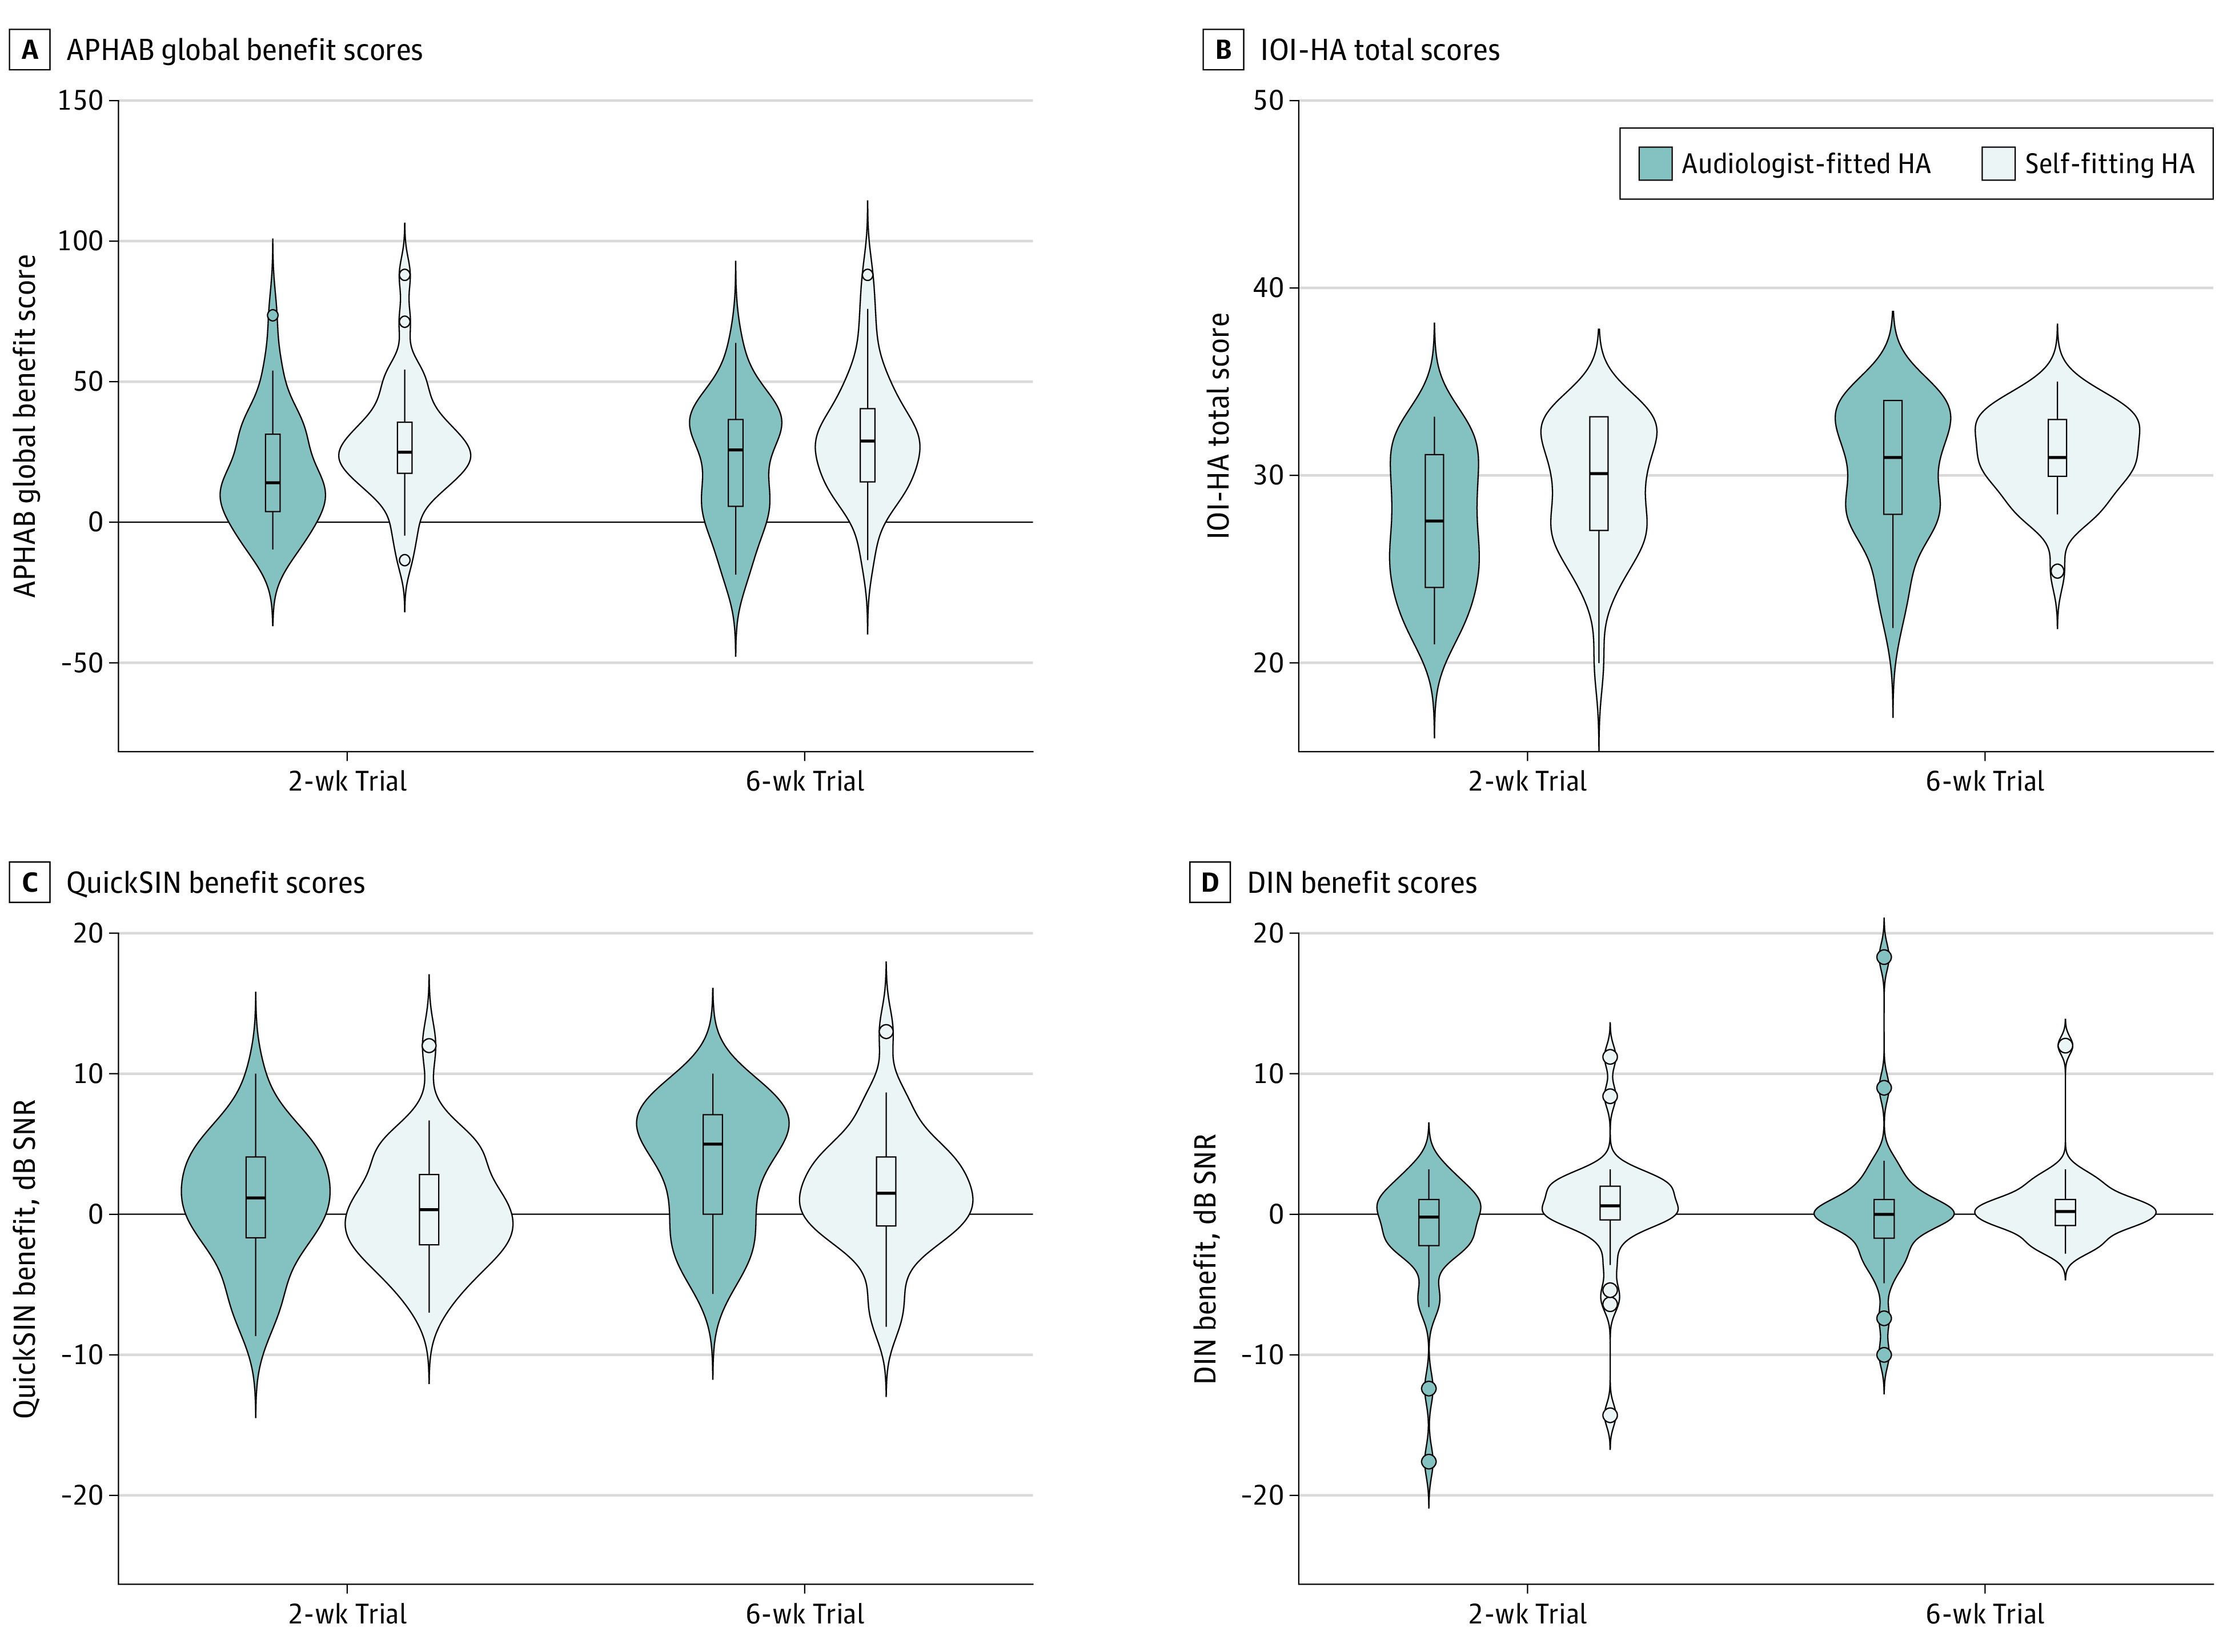
Figure 2. Outcome Measures Across the Trial .

A, Abbreviated Profile of Hearing Aid Benefit (APHAB) benefit scores range from 1% to 99%, with higher scores indicating better outcomes. B, International Outcome Inventory for Hearing Aids (IOI-HA) total scores range from 1 to 35, with higher scores indicating better outcomes. C, QuickSIN total scores range from −25.5 to 25.5, with higher scores indicating better outcomes. D, Digits-in-noise (DIN) test scores range from −22.5 to 22.5, with higher scores indicating better outcomes. Outcomes were measured in the audiologist-fitted and self-fitting groups measured at 2 and 6 weeks post hearing aid fitting. Violin plots indicate kernel probability density. Boxes are IQR with median, and whiskers are 1.5 times the IQR.
