
Figure 3.
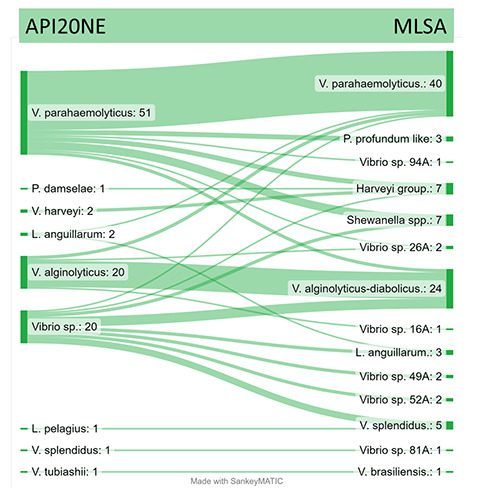
Sankey diagram of the whole Vibrio dataset (99 strains). The two blocks of nodes are related to the different identification methods (phenotypic API20NE vs Multilocus Sequence Analysis). Each node is the taxonomic attribution according to each classification method; the stream fields between the blocks represent the different attribution of these clusters in relation to each Vibrio species.