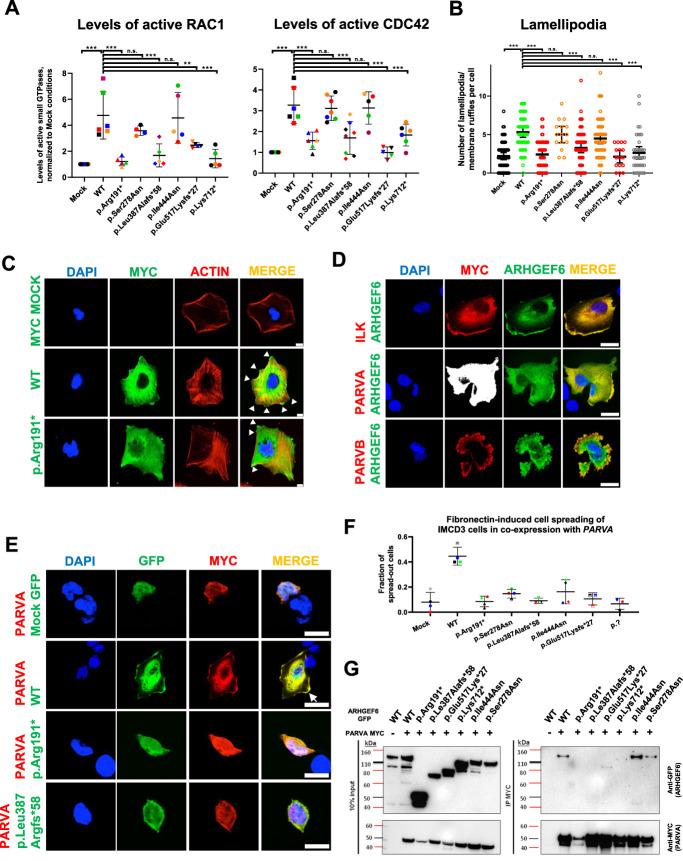
Figure 2.
ARHGEF6 increases levels of active CDC42 and RAC1, lamellipodia formation, and FN-induced cell spreading in renal cells. (A) HEK293T cells were transfected with ARHGEF6 WT cDNA and cDNA representing proband variants. After 24 hours, transfection active levels of CDC42 and RAC1, respectively, were measured by G-LISA assay and normalized to MOCK. Each color represents an individual experiment. p.Lys712* indicates splice variant of family GM2. **P<0.01; ***P<0.001; ns, not significant, ordinary one-way ANOVA. (B) Human podocytes were transfected with N-MYC ARHGEF6 WT and mutant cDNA representing proband variants. After 24 hours, cells were fixed and stained with anti-MYC (DaM488) and phalloidin (594) representing F-actin. Lamellipodia/membrane ruffles were counted in a blinded way in three independent experiments (approximately 20 cells/group/experiment counted; p.Glu517Lysfs*27 and p.Pro278Ser only two experiments). Lamellipodia/membrane ruffle was defined as convex cell protrusion. P<0.001 ***, n.s., not significant, Kruskal–Wallis test. (C) Representative images for lamellipodia/membrane ruffle formation, quantified in (B). White arrowheads indicate lamellipodia/membrane ruffles. Scale bar 10 µm. (D) Human podocytes were cotransfected with GFP-tagged WT ARHGEF6 cDNA and c-MYC-tagged ILK cDNA (upper panel), c-MYC-tagged PARVA cDNA (middle panel), or c-MYC-tagged PARVB cDNA (lower panel). After 24 hours, cells were fixed and stained with anti-MYC (secondary antibody DaM594). Note that ARHGEF6 colocalizes with ILK, PARVA, and PARVB, especially in the cell periphery (white arrow). Scale bars 25 µm. (E) IMCD3 cells were cotransfected with GFP-tagged ARHGEF6 (WT/proband-derived variants) and c-MYC-tagged PARVA cDNA. Twenty-four hours after transfection, cells were trypsinized, counted, and plated on FN-coated glass slides. Cells were allowed to attach for 5 hours, washed, and then fixed, followed by antibody staining with anti-MYC (secondary antibody DaM594). Cell morphology was assessed in double-positive cells only and in at least 40 cells per condition. Cell spreading was quantified in a dichotomous way (cells spread or not spread). Scale bars 25 µm. (F) Graph shows quantification of (E) as fractions of spread-out cells per conditions. Different colors represent four independent experiments. (G) HEK293T cells were transfected with GFP-tagged ARHGEF6 (WT versus proband mutants) and c-MYC-tagged PARVA cDNA. Note that GFP ARHGEF6 WT coimmunoprecipitates with MYC-tagged PARVA in HEK293T cells, but not with GFP control vector (MOCK), with early truncating variants (p.Arg191* and p.Le387Alafs*58) and only weakly with late truncating variants (p.Glu517Lys*27 and p.Lys712*). Left panel shows input and right panel immunoprecipitate (IP) immunoblots.

