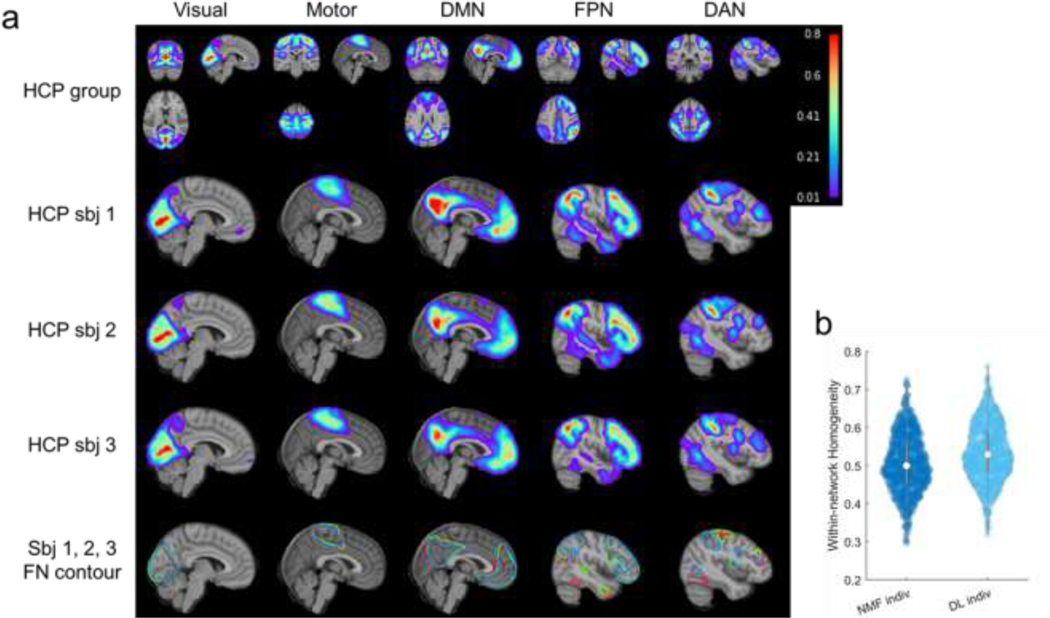
Fig. 4.
Personalized functional networks identified by the DL model for three randomly selected individuals from the testing cohort of HCP REST1 dataset, including visual network, somatomotor network, default mode network (DMN), fronto-parietal control network (FPN), and dorsal attention network (DAN). (a) Average FNs of all testing HCP subjects (the first row), three individual subjects’ personalized FNs in sagittal view (the second, third, and fourth rows), and isolines of the FNs at a value of 0.15 in different colors (the fifth row). (b) Personalized FNs computed using the DL model had significantly higher functional within-network homogeneity than those computed using the spatially-regularized NMF (, Wilcoxon signed rank test). Each datapoint in the plot denotes the average functional homogeneity across all FNs of one subject.

