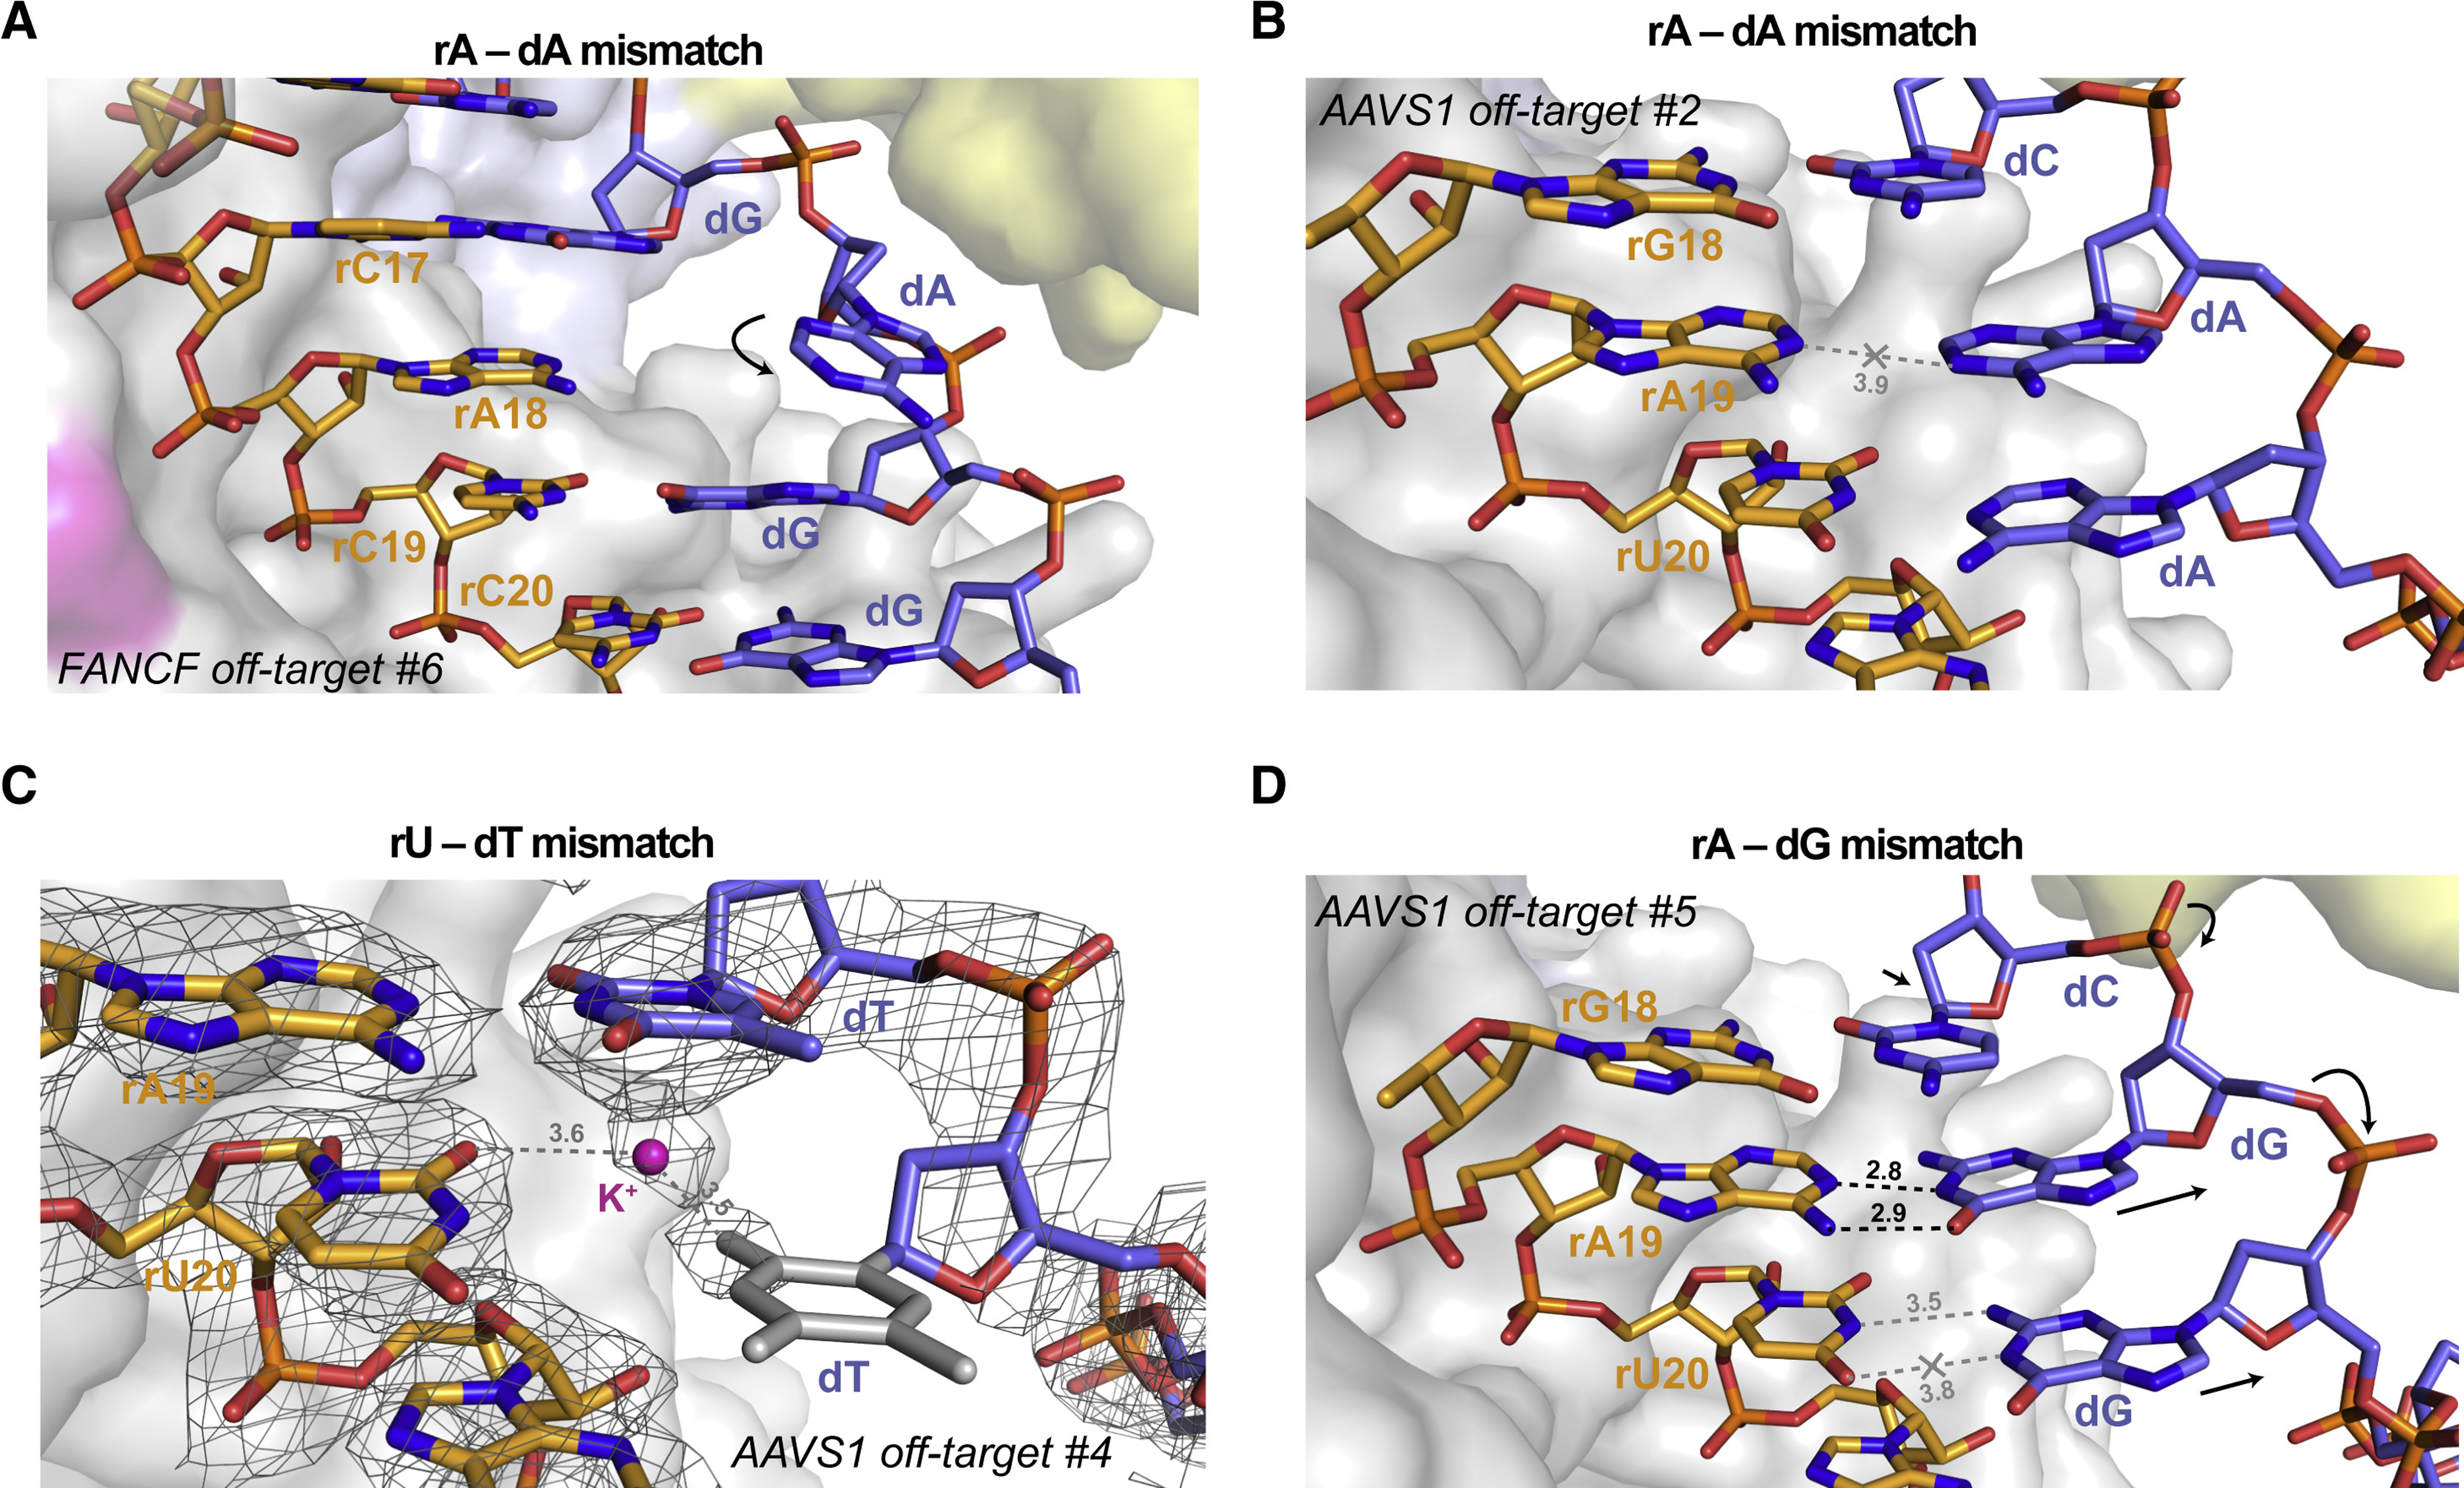
Figure 4. TS distortion facilitates mismatch accommodation in the seed region of the guide–off-target heteroduplex.

(A) Close-up view of the rA-dA mismatch at position 18 in FANCF off-target #6 complex, showing major groove extrusion of the dA base. (B) Close-up view of the rA-dA mismatch at position 19 in AAVS1 off-target #2 complex, showing retention of the dA base in the duplex stack. (C) Zoomed-in view of the rA-dG base pair at position 19 and the unpaired rU-dG mismatch at position 20 in the AAVS1 off-target #5 complex. (D) Close-up rU-dT mismatch at the PAM-proximal position 20 in AAVS1 off-target #4 complex. Residual electron density indicates the presence of an ion or solvent molecule. Refined 2mFo−DFc electron density map of the heteroduplex, contoured at 1.5σ, is rendered as a grey mesh. Structurally disordered thymine nucleobase for which no unambiguous density is present is in grey. Arrows indicate conformational changes in the TS backbone relative to the on-target complex. See also Figure S14.
