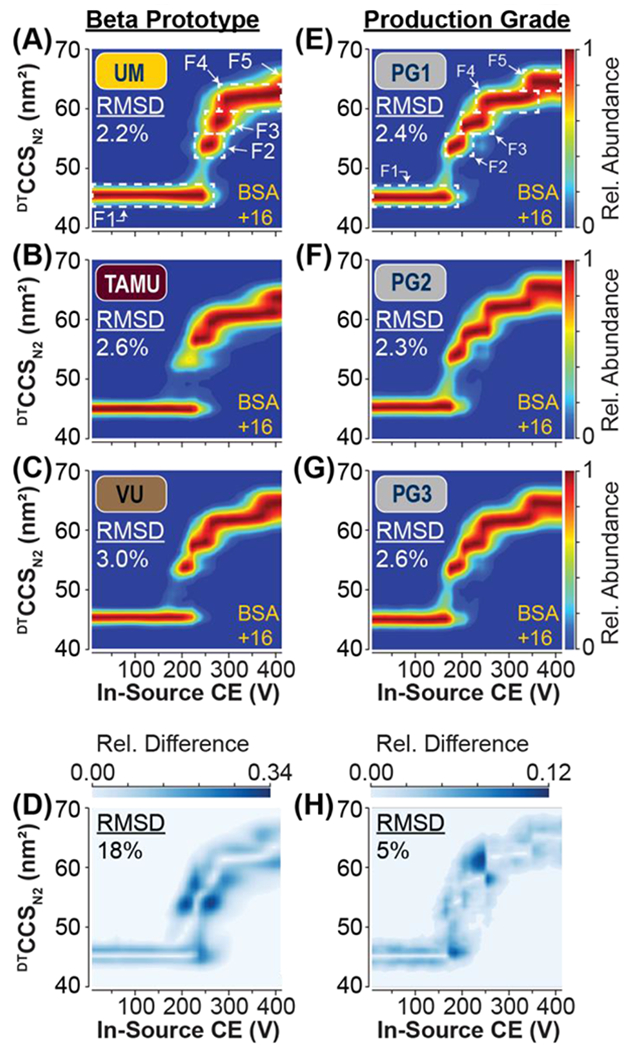
Figure 4: Interlaboratory CIU Fingerprints of BSA +16 and Development of Production-grade Source Hardware.

Average CIU fingerprint of BSA +16 ions acquired on three independent beta prototype DTIM-MS instruments located at (A) UM, (B) TAMU, and (C) VU. Intralaboratory CIU reproducibility is indicated by RMSD in the top left corner of each fingerprint. (D) CIU difference plot indicating the areas of highest difference between the CIU fingerprints from the three laboratories (A-C), resulting in an interlaboratory RMSD of 18%. CIU of BSA +16 ions acquired on three independent production-grade hardware assemblies (E-G). CIU difference plot indicating the areas of highest difference between the CIU fingerprints from PG1-3 (E-G), resulting in an interhardware RMSD of 5%.
