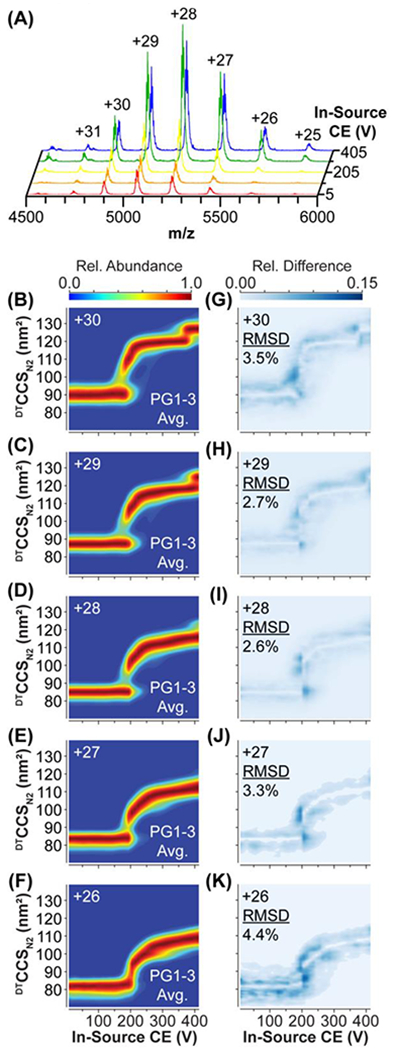
Figure 5: IgG1 CIU using Production-grade CIU Hardware.

(A) IgG1 mass spectra during a CIU experiment at 5 V (red), 105 V (orange), 205 V (yellow), 305 V (green), and 405 V (blue). Interhardware average CIU fingerprints (B-F) and CIU Difference plots (G-K) For +30 to +26 charge states, indicating areas of greatest difference between CIU fingerprints from the 3 production prototypes, and the interhardware RMSD.
