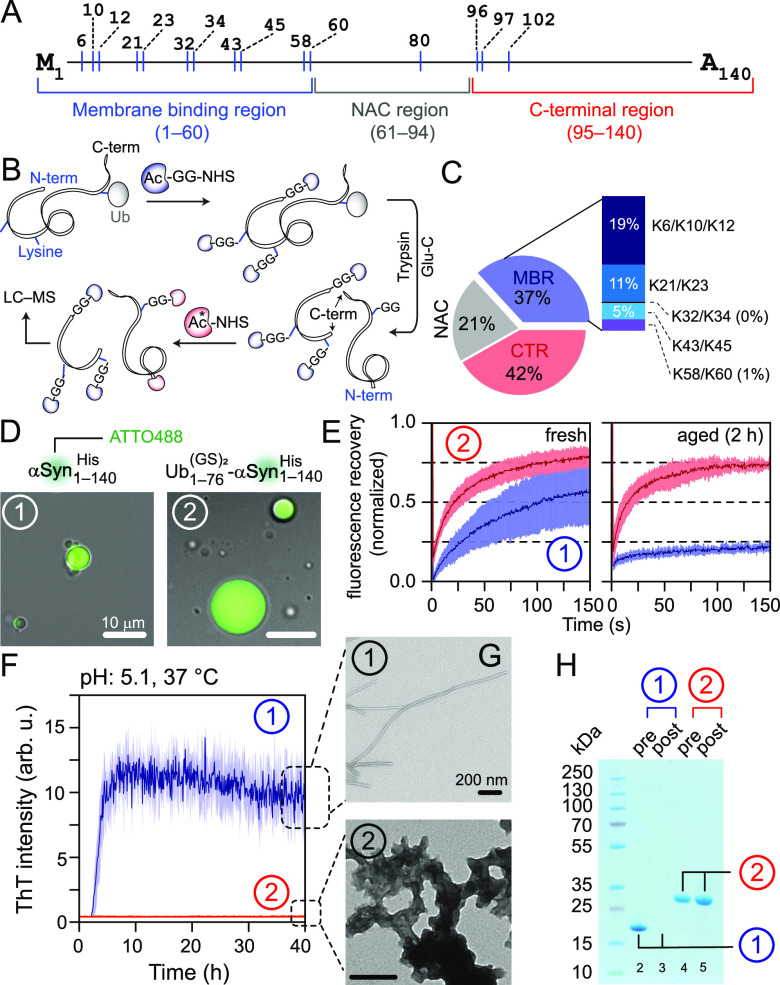
Figure 2.
Impact of NEDD4L-mediated monoubiquitination on α-synuclein’s aggregation. Schemes of (A) α-synuclein and (B) quantitative chemical proteomics used to determine monoubiquitination stoichiometry; the asterisk denotes 13C-labeled acetyl-NHS. (C) Pie-chart of the average frequency of monoubiquitination in the MBR (blue), NAC (gray) and CTR (red) regions of αSyn1–140His (n = 2). Unlike the CTR, the monoubiquitination frequency for the individual lysine residues of MBR could be deconvoluted, represented by a stacked bar. (D) Microscopy images of droplets of αSyn1–140 and its monoubiquitinated counterpart with 10% w/v PEG-8000, represented by circled no. 1 and 2, respectively; the same numbering scheme is used in the remaining panels. (E) FRAP analysis of freshly prepared and aged condensates with the solid line and shaded region representing the mean and SD (n = 3), and blue and red colors for unmodified and monoubiquitinated αSyn1–140His, respectively. (F) Aggregation of non- and monoubiquitinated αSyn1–140 studied by ThT assays (n = 2); the same color-scheme as E. (G) Negative-stain EM images of aggregated samples from F showing fibrils for αSyn1–140His and amorphous aggregates for its monoubiquitinated moieties. (H) SDS-PAGE analysis of pre- and postaggregated samples from F. The lack of band intensity in lane-3 is due to αSyn1–140 fibrillization.

