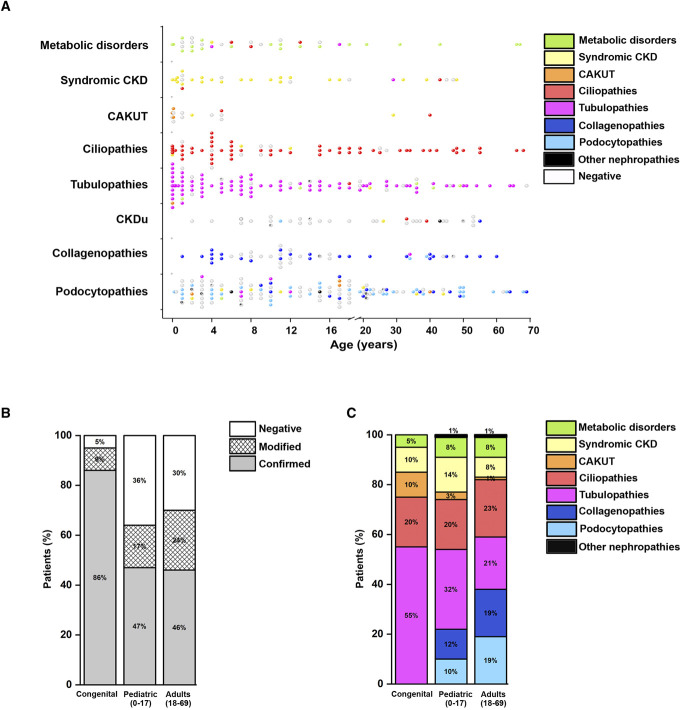
Figure 3.
Diagnostic rate and genetic findings in different age groups. (A) Distribution of genetic diagnosis according to age in the eight clinical categories (podocytopathies, collagenopathies, CKDu, tubulopathies, ciliopathies, CAKUT, syndromic CKD, metabolic kidney disorders). Each dot represents a patient. Dots are colored according to the genetic diagnosis. Age is reported in years. (B) Diagnostic rate according to age in the study population (476 patients). For each age group (congenital, pediatric, adults), we show confirmed (gray), modified (reticulated), and negative (white) results. Age is reported in years. (C) Genetic findings according to age in 319 patients with a genetic diagnosis. Age is reported in years. CAKUT, congenital anomalies of the kidney and urinary tract; CKDu, CKD of unknown origin.

