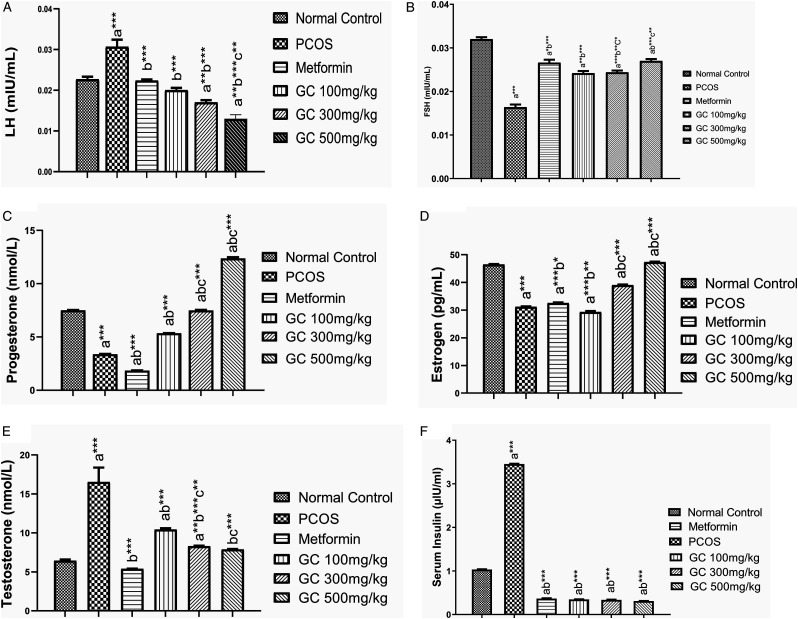
Figure 7.
Effect on hormonal profile (A) LH (B) FSH (C) Progesterone (D) Estrogen (E) Testosterone (F) Insulin.
Values are expressed as mean ± SEM (n = 5). adenotes significant difference from Normal Control; bdenotes significant difference from Disease Control (PCOS); cdenotes significant difference from AEGC 100 mg/kg; results were compared by one-way ANOVA followed by Tukey’s multiple comparisons test. *P < .05, **P < .01, ***P < .001.

