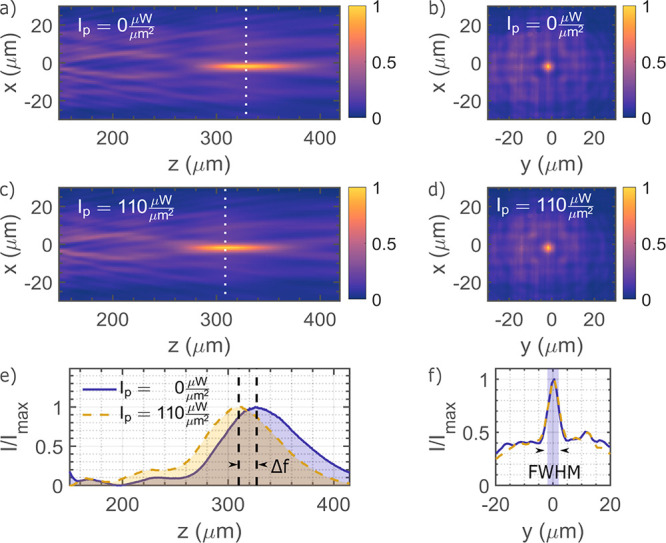
Figure 4.

Optical characterization of the focal length with pump light ON and OFF. (a, c) 2D intensity maps in the xz-plane with the pump intensities Ip = 0 μW/μm2 and Ip = 110 μW/μm2, respectively. (b, d) 2D intensity profile of the focal spot in its respective focal plane (xy) under the pump intensities Ip = 0 μW/μm2 and Ip = 110 μW/μm2, respectively. (e) Axial optical intensity distribution for the two pump intensities. (f) 1D cut of the focal spot across the y-axis for the two pump intensities (blue solid line for Ip = 0 μW/μm2 and yellow dashed line for Ip = 110 μW/μm2. The fwhm is highlighted by the blue shaded area. All intensity profiles are normalized to the maximum probe intensity for the given pump intensity.
