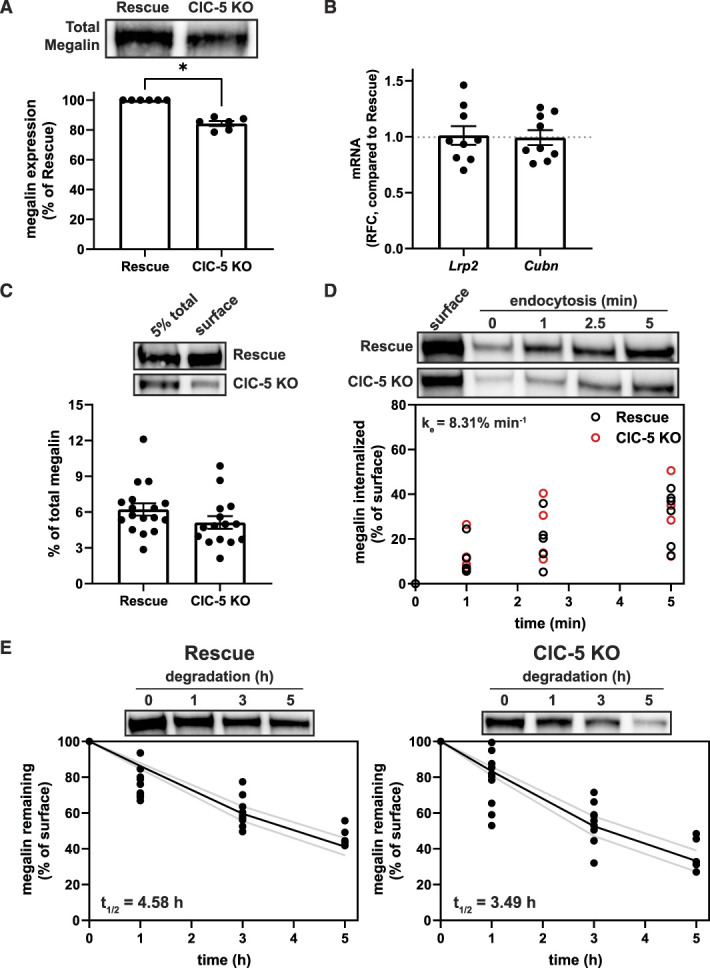
Figure 2.

Expression and trafficking of megalin is impaired in ClC-5 KO cells. (A) Equivalent amounts of protein from rescue and ClC-5 KO cell lysates were blotted for megalin. The quantified band intensity for each independent experiment was normalized to rescue cells. A representative blot is shown above the graph. *P=0.0169 (n=6 experiments) using one-way ANOVA Tukey multiple comparison test. (B) megalin (Lrp2) and cubilin (Cubn) transcripts in rescue and ClC-5 KO cells were quantified by quantitative PCR and normalized to Gapdh transcript levels. Relative fold change (RFC) of ClC-5 KO cells compared with rescue cells (normalized to 1; dotted line) is plotted. (C) The apical surfaces of rescue and ClC-5 KO cells were biotinylated, and total (5%) and surface megalin were quantified by blotting. Representative blots are shown above the graph. (D) Endocytosis kinetics of rescue and ClC-5 KO cells were quantified using the biotinylation stripping approach described in Methods, and internalized megalin was quantified as a percentage of surface megalin at t=0. Data from five ClC-5 KO and six rescue experiments are plotted and were used to calculate the fractional endocytic rate for rescue and ClC-5 KO cells as described in Methods, shown in upper left corner. Representative blots are shown above the graph. (E) Data from 11 independent experiments were used to fit (black line) the degradation rate of apically biotinylated megalin in rescue and ClC-5 KO cells using estimates of fractional endocytic rate (Figure 2D and Supplemental Table S8) and the fraction of megalin at the apical surface (gray lines: 95% CI). The estimated half-life of surface megalin is shown in the bottom left corner of each graph. Representative blots are shown above each graph.
