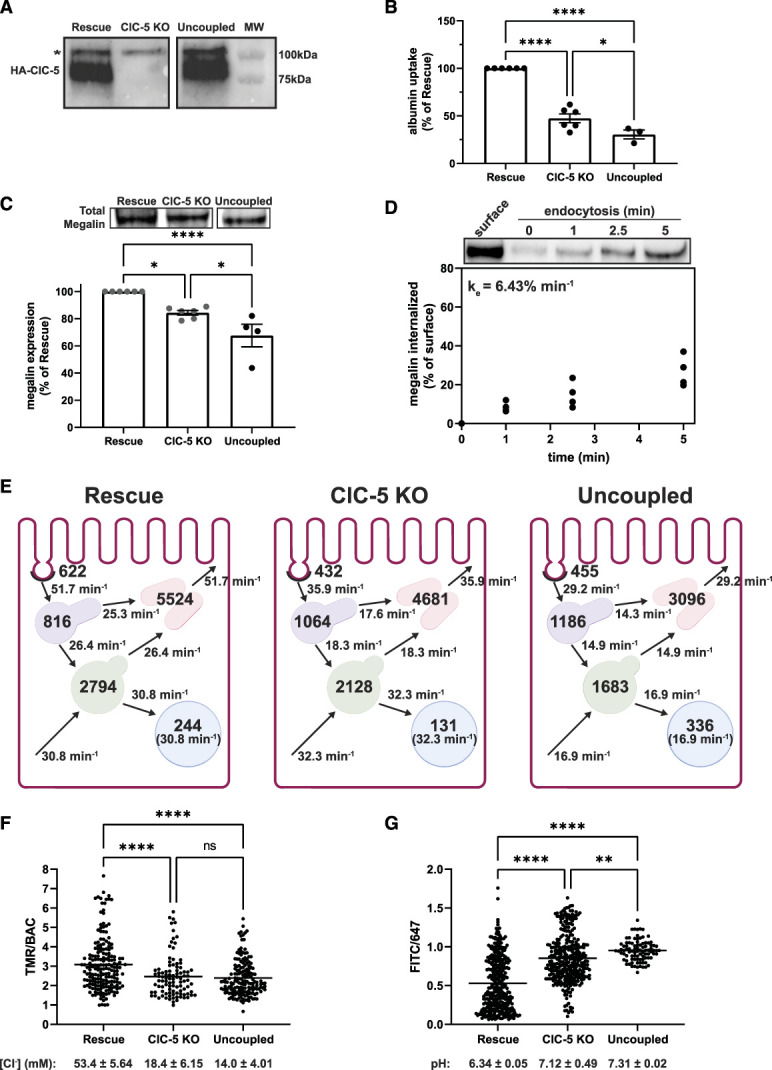
Figure 5.

The uncoupled mutant ClC-5E211G impairs endocytic function more than knockout. Equivalent amounts of protein from rescue, ClC-5 KO, and uncoupled lysates were blotted using anti-HA antibody to detect heterologously expressed wild-type (rescue) and ClC-5E211G (uncoupled). A representative blot is shown confirming comparable expression of HA-tagged protein in rescue and uncoupled clones (predicted molecular weight of ClC-5–80 kDa). Blot was cropped to remove middle lane. *Indicates a background band appearing in all three cell lines. (B) Uptake of fluorescent albumin in rescue, ClC-5 KO, and uncoupled cells was quantified by spectrofluorimetry as described in Methods and then normalized to uptake in rescue cells. **P=0.0283 and ****P<0.0001 (n=3–6 experiments) using the one-way ANOVA Tukey multiple comparison test. (C) Equivalent amounts of protein from rescue, ClC-5 KO, and uncoupled cells were blotted for megalin, and the quantified band intensities in each experiment were normalized to rescue cells. *P=0.0213 and ***P=0.0001 (n=4–6) using the one-way ANOVA Tukey multiple comparison test. A representative blot is shown above the graph. Blot was cropped so that data could be presented in the same order as the rest of the figure. The data for rescue and ClC-5 KO are the same as shown in Figure 2A and are indicated in dark gray. (D) Endocytosis kinetics of uncoupled cells was quantified using the biotinylation stripping approach described in Methods. Data from four independent experiments are plotted, and a representative blot is shown above the graph. The fractional endocytic rate was calculated as described in Methods and is shown in the upper left corner. (E) Graphical representation of the model of megalin traffic in rescue, ClC-5 KO, and uncoupled cells. Values with the compartments denote steady state distribution of 10,000 molecules of megalin in rescue, 8437 molecules in ClC-5 KO, and 6756 molecules in uncoupled based on the calculated differences in total megalin expression in panel C. Kinetic rate values are shown as the number of megalin molecules trafficked per minute from the originating compartment. (F) Rescue, ClC-5 KO, and uncoupled cells were incubated for 3 minutes with a mixture of BAC- and TMR-dextrans to load early endosomes and then rapidly imaged by confocal microscopy. The ratio of TMR to BAC intensities within endosomes was quantified as described in Methods. Each point represents a single endosome. ****P<0.0001 (n=97–185) using the one-way ANOVA Tukey multiple comparison test. The intensity ratios were converted to [Cl−] (mM) based on the calibration curve shown in Supplemental Figure S6A. The average [Cl−] (±SEM) for each cell line is shown below the graph. (G) Rescue, ClC-5 KO, and uncoupled cells were incubated for 3 minutes with a mixture of FITC- and Alexa Fluor 647-dextrans to load early endosomes and rapidly imaged by confocal microscopy. The ratio of FITC to 647 intensities within endosomes was quantified as described in Methods. Each point represents a single endosome. ****P<0.0001 and *P=0.0363 (n=91–348) using the one-way ANOVA Tukey multiple comparison test. The intensity ratios were converted to pH based on the calibration curve shown in Supplemental Figure S6B. The average pH (±SEM) for each cell line is shown below the graph.
