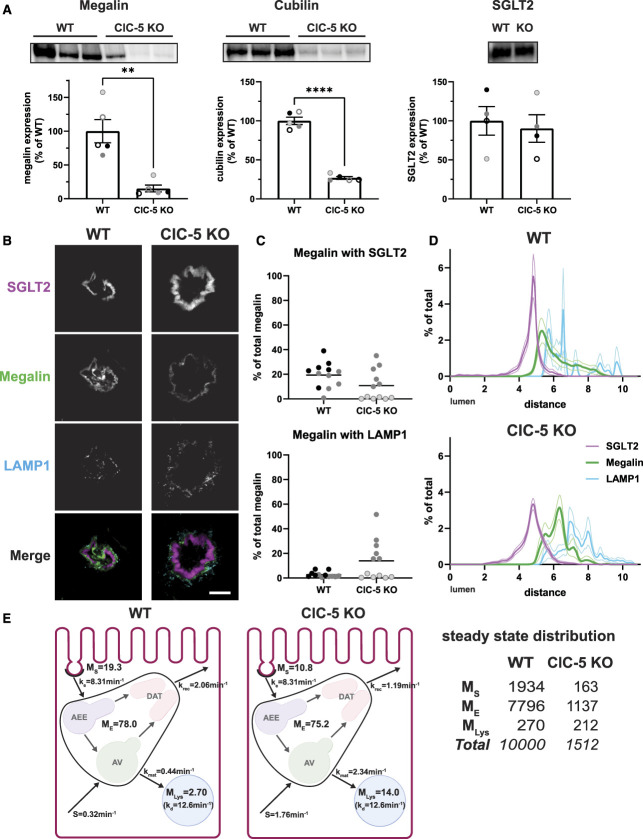
Figure 6.
ClC-5 KO alters the distribution of megalin in mouse S1 PT cells. (A) Equivalent amounts of protein from WT and ClC-5 KO mouse kidney cortex lysates were blotted for megalin, cubilin, and SGLT2. The quantified band intensity was normalized to the average of the WT mice. Each symbol corresponds to a different mouse. **P=0.0061 (n=5) using the Welch t-test and ****P<0.0001 (n=5) using an unpaired t-test. (B–D) Cortical kidney sections from 10- to 12-week-old male WT and ClC-5 KO mice were stained to label SGLT2, megalin, and LAMP1. (B) Representative sum projection images (10 planes) of megalin colocalization with SGLT2 and LAMP1 in an end-on tubule are shown. Scale bar: 10 µm. The weak staining on the basal aspect of the tubule in the megalin channel is due to background binding of the secondary antibody. (C) Colocalization of megalin with SGLT2 (top) and LAMP1 (bottom) in WT and ClC-5 KO mice, quantified by Manders coefficient over the entire z-stack, is plotted as a percent of total megalin. Each point represents a single end-on tubule with different symbols indicating different mice as in panel A. ****P<0.0001 (n=24) using an unpaired t-test. (D) The average fractional distribution of SGLT2, megalin, and LAMP1 in cells from S1 segment of WT (top; n=17 from two mice) and ClC-5 KO (bottom; n=22 from two mice) mice is plotted over distance (arbitrary units) from lumen. Note the basolateral shift of the megalin distribution of ClC-5 KO compared with WT mice. (E) Graphical representation of the abridged model of megalin traffic in S1 segment of mouse WT and ClC-5 KO PT. Megalin is divided into a surface pool (); an intracellular pool within endosomes () that comprises AEEs, AVs, and DATs; and a lysosomal pool (). Values within the pools denote the steady state distribution of as a percent of total megalin in WT (left) and ClC-5 KO (middle) mice. Kinetic rate values are the percentage of megalin in the originating compartment trafficked per minute. The synthesis () rate and degradation () rates represent the percent of total megalin synthesized per minute and megalin in that is degraded per minute, respectively. The table (right) shows the steady state distribution of megalin in WT and ClC-5 KO mice in megalin molecules for every 10,000 molecules in WT and 1512 molecules in ClC-5 KO, based on the calculated differences in total megalin expression in panel A. Adapted from Shipman et al., 2022, Function.29

