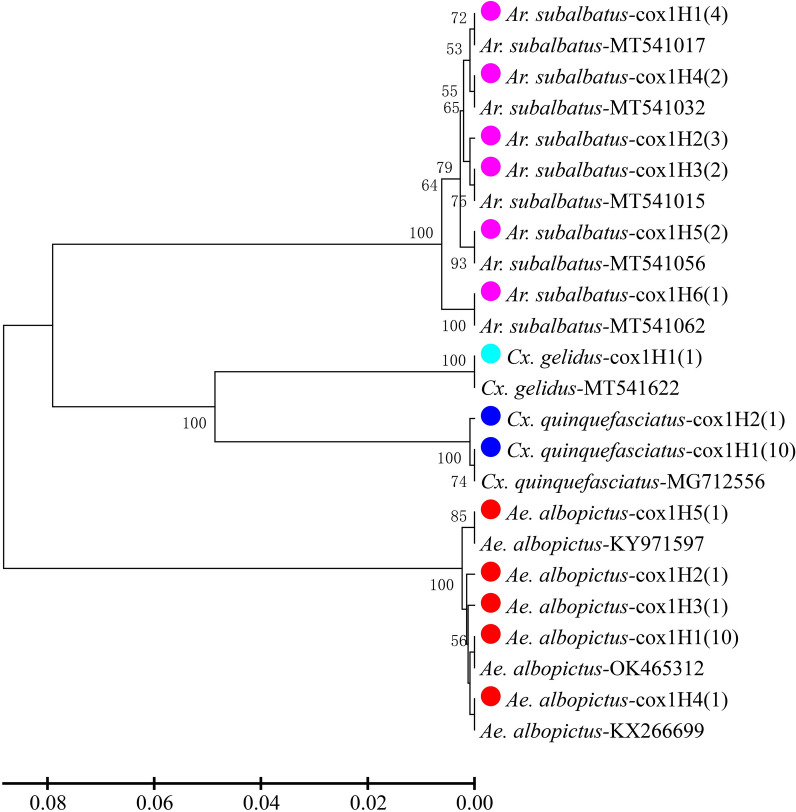
Fig. 3.
Phylogenetic tree analysis of cox1 haplotypes of different mosquito species collected in Hainan Province. Phylogenetic inference was performed using the UPGMA method. The percentage of replicate trees (> 50) in which the associated haplotypes clustered together in the bootstrap test (1000 replicates) is shown next to each branch. The evolutionary distances were computed using the Kimura two-parameter method; units are the number of base substitutions per site. Colored dots indicate haplotypes of different species identified in this study; numbers in parentheses indicate the abundance of each haplotype. Species name followed by GenBank accession number is provided for reference

