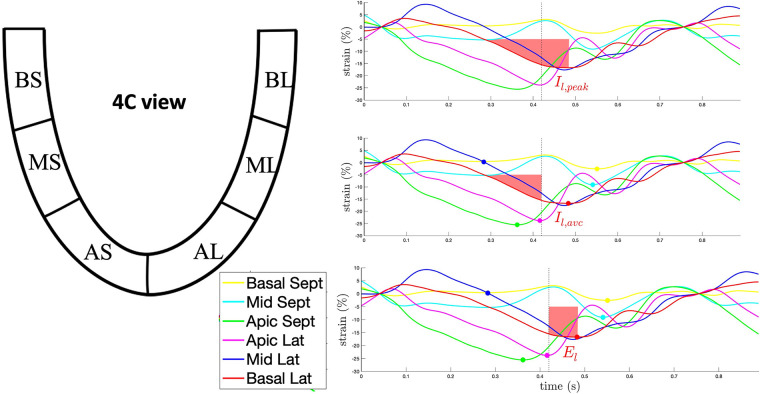
Figure 2.
Example of the semi-quantitative analysis of the strain curve dynamics through the calculation of strain integrals for the basolateral segment in 4-chamber view. Upper panel: the red-shaded area represents the integral to strain peak (Il,peak). Middle panel: the red-shaded area represents the integral to aortic valve closure (Il,AVC). Lower panel: the red-shaded area represents El, the difference between Il,peak and Il,AVC, corresponding to the waste energy due to the delayed lateral wall contraction. AL, apico-lateral segment; AS, apico-septal segment; BL, basal-lateral segment; BS, basal-septal segment; ML, mid-lateral segment; MS, mid-septal segment.

