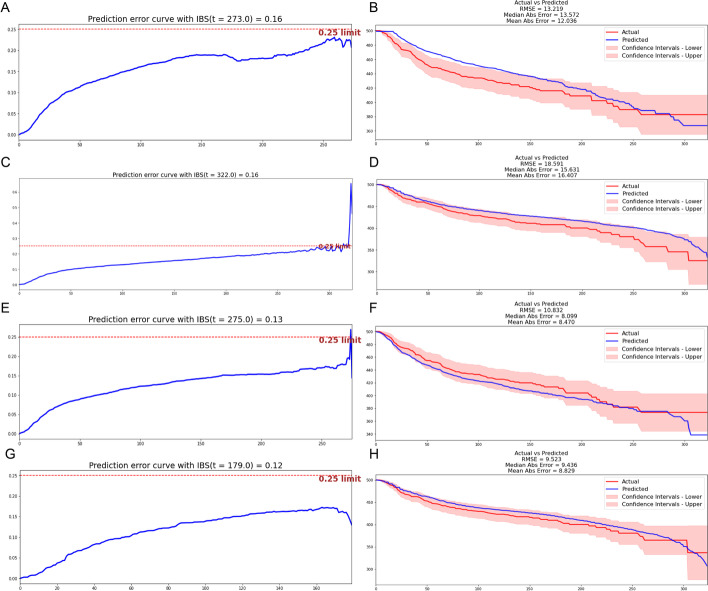
Fig. 3.
performance of other models including CPH model, LMT model, RSF model, and SVM model. A The IBS of the CPH model in the test set is 0.16. B Survival curves of the testing set according to the CPH model. C The IBS of the LMT model in the test set is 0.16. D Survival curves of the testing set according to the LMT model. E The IBS of the RSF model in the test set is 0.13. F Survival curves of the testing set according to the RSF model. G The IBS of the SVM model in the test set is 0.12. H Survival curves of the testing set according to the SVM model

